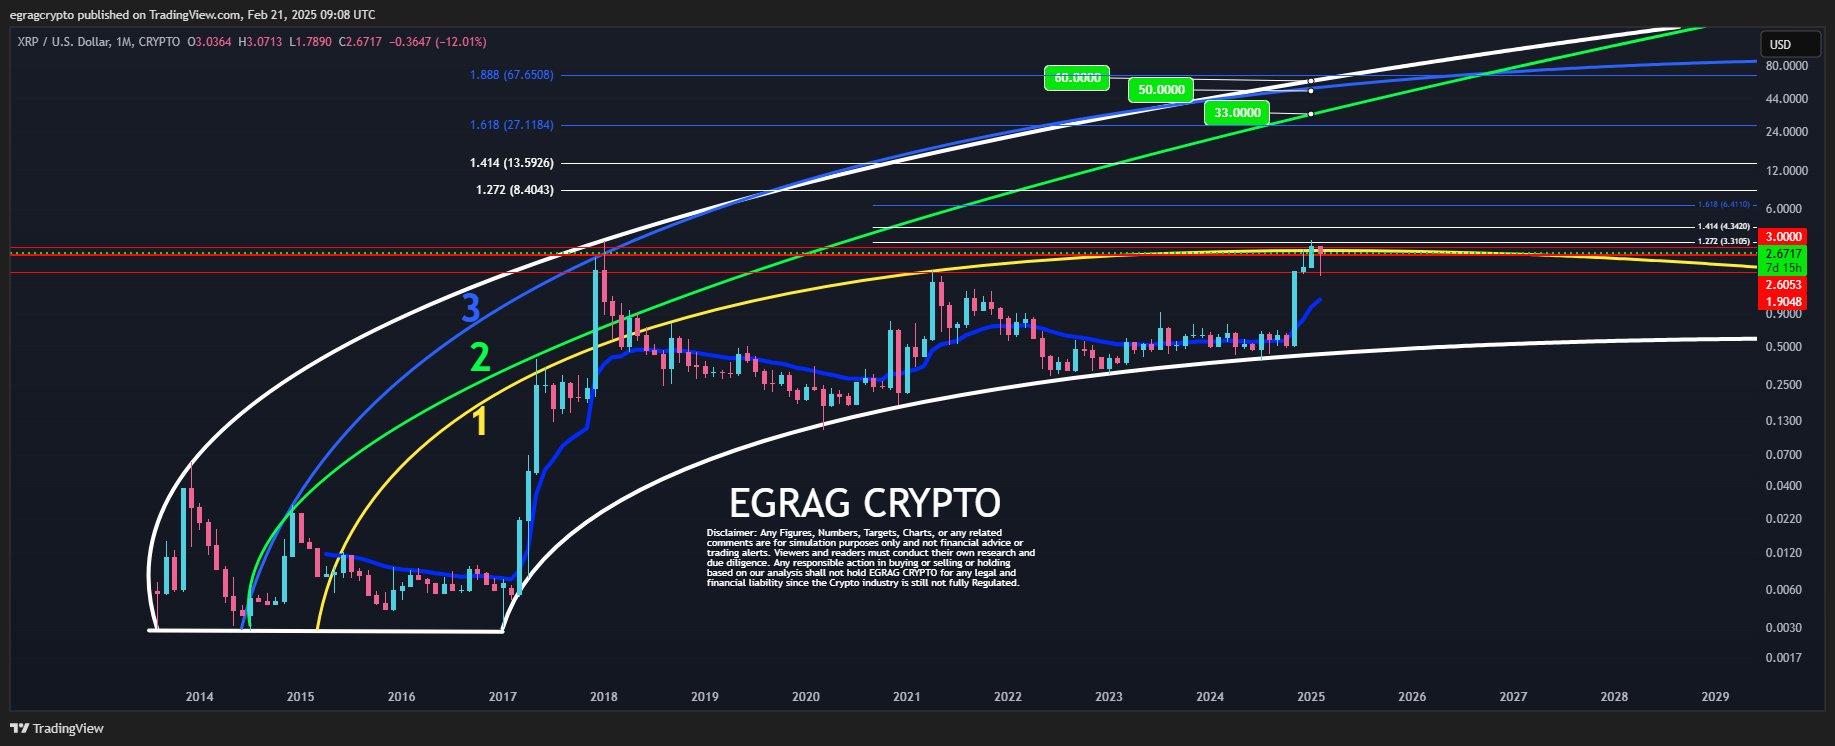
Crypto analyst Egrag Crypto (@egragcrypto) has outlined both short-term and long-term trajectories for XRP, pinpointing potential upside targets that range from $4–$6 in the near term to $33–$60 over the long haul. The shared chart focuses on historical resistance levels, Fibonacci extension points, and a multi-phase Parabolic Arc formation.
XRP Eyes $6—But This Key Level Stands In The Way
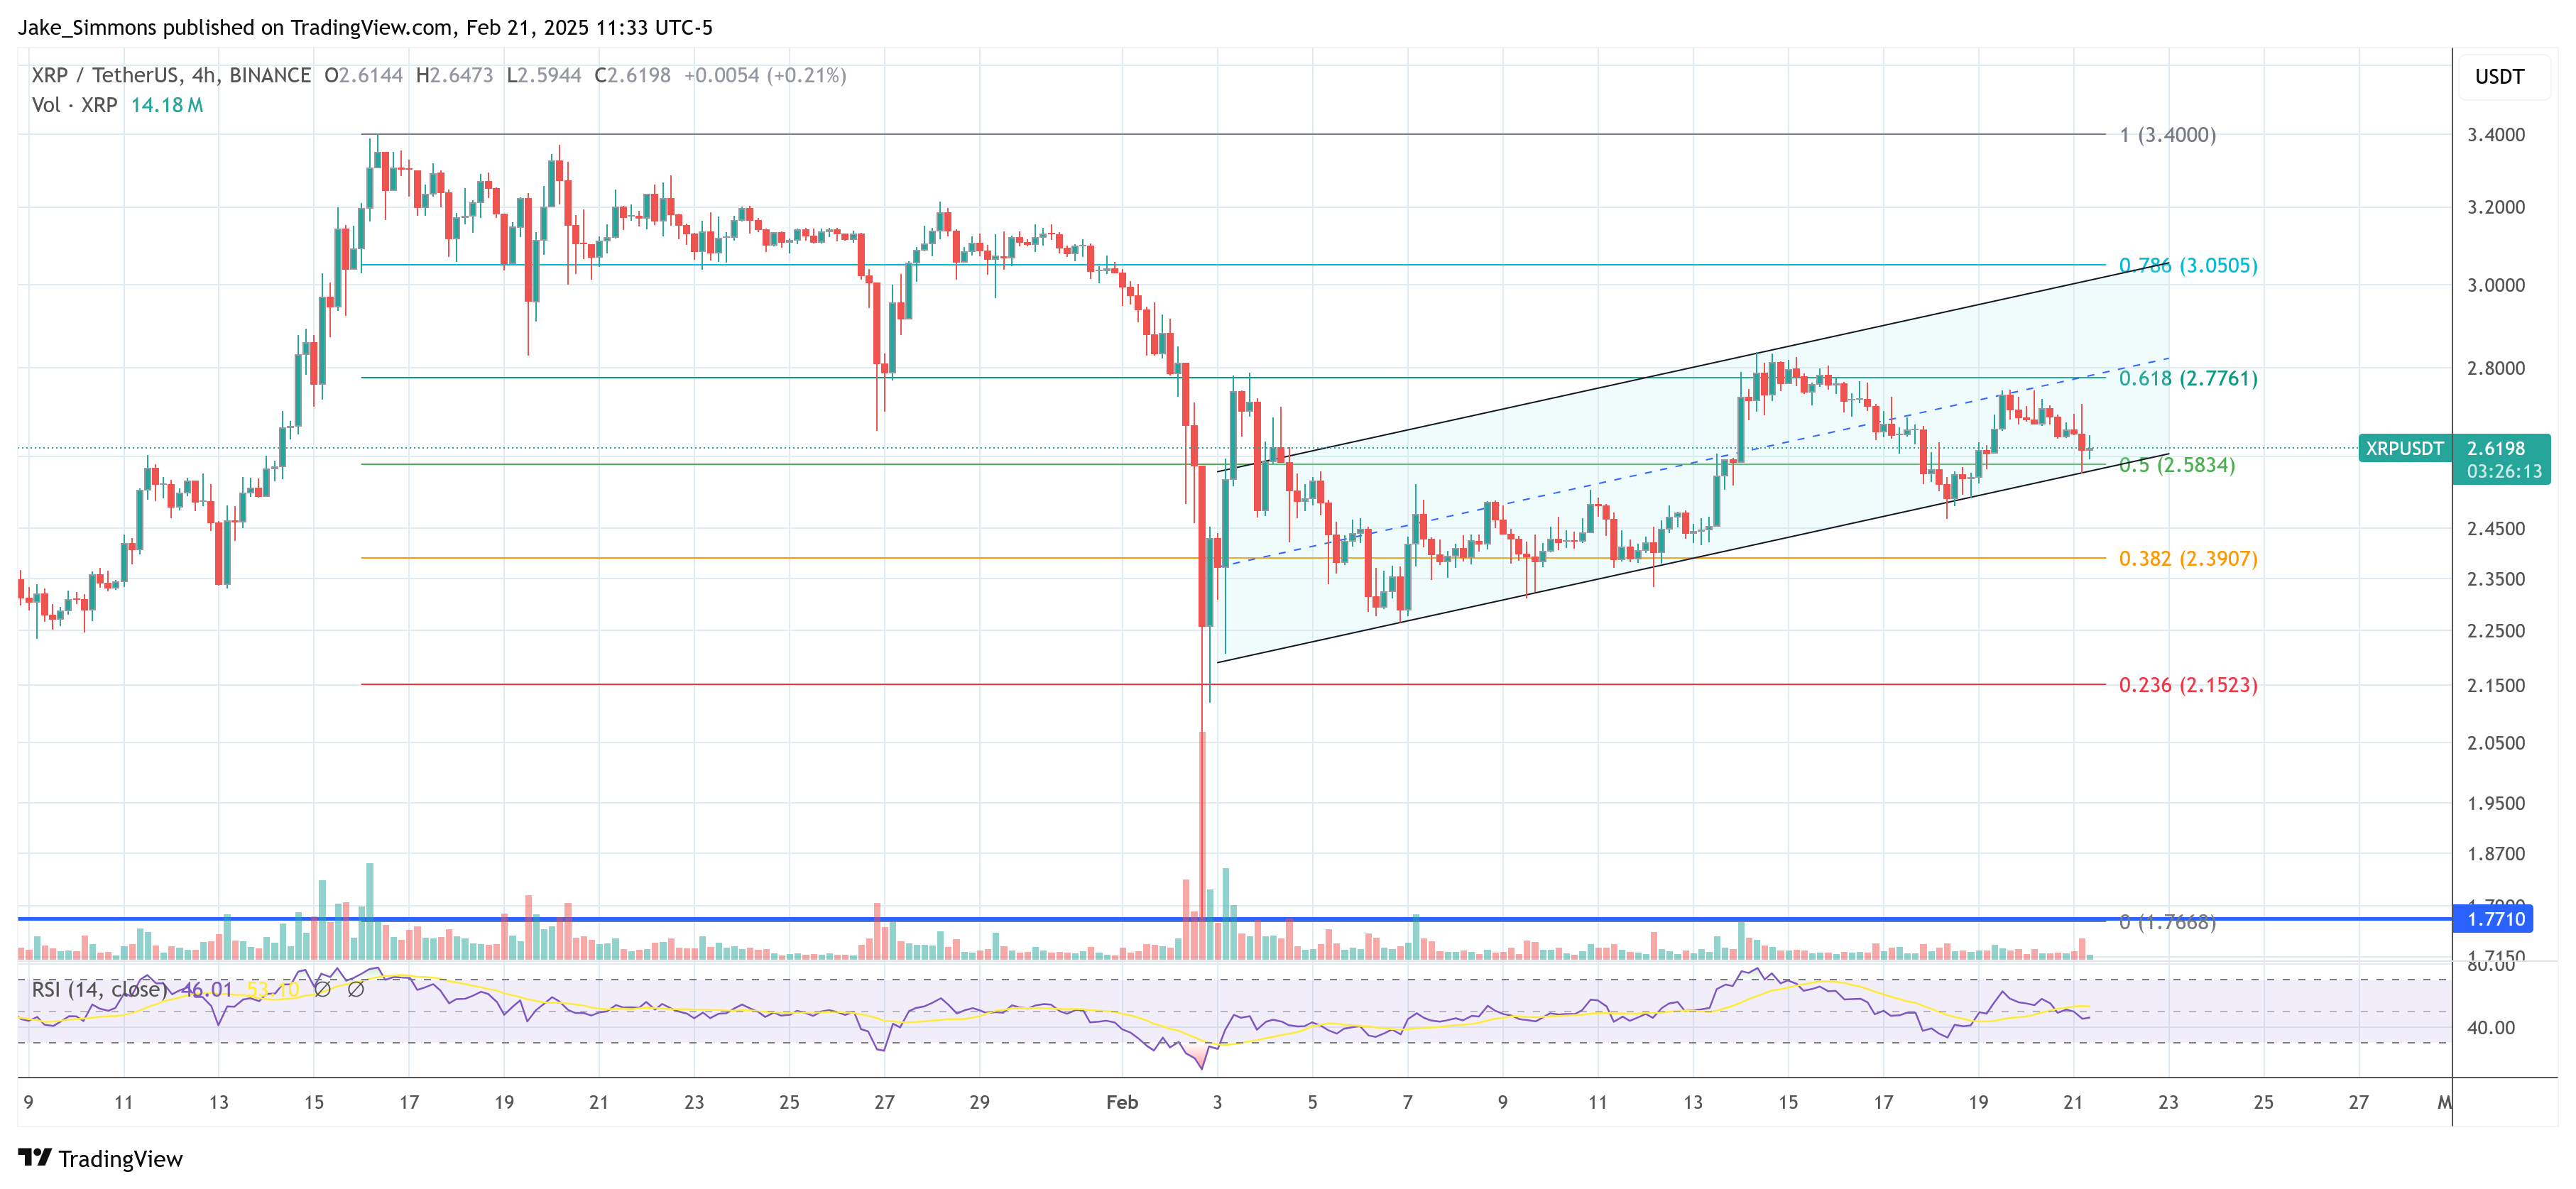
Egrag Crypto’s chart shows XRP trading near $2.67, coming off a notable bullish surge but now contending with a red horizontal band between roughly $2.75 and $3.00. The upper boundary at $3.00 holds dual significance: it marks a psychologically important level and also corresponds to a critical area from previous cycle peaks. A monthly close above this line would strongly suggest a bullish continuation, potentially setting the stage for a move toward the next Fibonacci extension marks.
“XRP current price action is trading at $2.67, showing a strong bullish move but facing resistance at the red horizontal zone (~$2.75-$2.83-$2.910 and $3.00),” Egrag states. The analyst particularly highlights Fib 1.414 near $4.30 and Fib 1.618 around $6.40 as the next barriers if $3.00 is decisively broken. A volume surge would strengthen the bullish case and provide extra confirmation for the run to unfold.
Failure to overtake $3.00, however, could trigger a correction back into the $1.90–$2.00 support region identified by earlier candle closes. Egrag Crypto notes that if $1.90 fails to hold, a more extensive drop toward $0.90–$1.00 could ensue, which the analyst labels as a potential “Black Swan” scenario likely driven by broader market turmoil rather than XRP-specific weakness.
Egrag writes: “Breaking below $1.90 could shift sentiment to bearish, introducing downside risks toward the $0.90-$1.00 range. This would signal a potential Black Swan event across all markets! Such a collapse would be a challenging prelude before the ignition stage for XRP. Honestly, I don’t favor this scenario, as it would be stressful for all of us, including many OGs. Could the upcoming fort knox auditing be the catalyst for this Black Swan.”
In the long term, the chart presents three sweeping parabolic arcs—colored yellow, green, and blue—which suggest that XRP may be building a broad-scale bullish structure. Price targets in the $33–$60 range reflect these arcs and channel extensions, though much hinges on whether a monthly close above $3.00 can usher in sustained momentum.
Beyond the $6.40 level at Fib 1.618, Egrag Crypto identifies additional Fibonacci-related checkpoints, such as $8, $13, $27, and $67 (Fib 1.888). These higher levels would remain speculative until XRP clears the nearer hurdles and demonstrates stable volume influx and price structure. “Volume and momentum confirmation would be crucial in the[se] coming phases,” he adds.
While the path forward depends on technical breakouts, Egrag Crypto underscores that near-term movement around $3.00 will be pivotal for setting the tone. A successful break above resistance could confirm targets in the $4–$6 window, and eventually open the door to the lofty parabolic objectives.
At press time, XRP traded at $2.6198.
#XRPNews, #Xrp, #XrpNews, #XRPPrice, #XRPPriceAnalysis, #XRPTechnicalAnalysis