Solana (SOL) is holding strong above the $160 mark after the broader market experienced a healthy dip to previous demand levels. Despite the dip, Solana has shown resilience, though the past few hours have been marked by short-term volatility with rapid price fluctuations. Investors are closely monitoring the next moves as Solana navigates this uncertain phase.
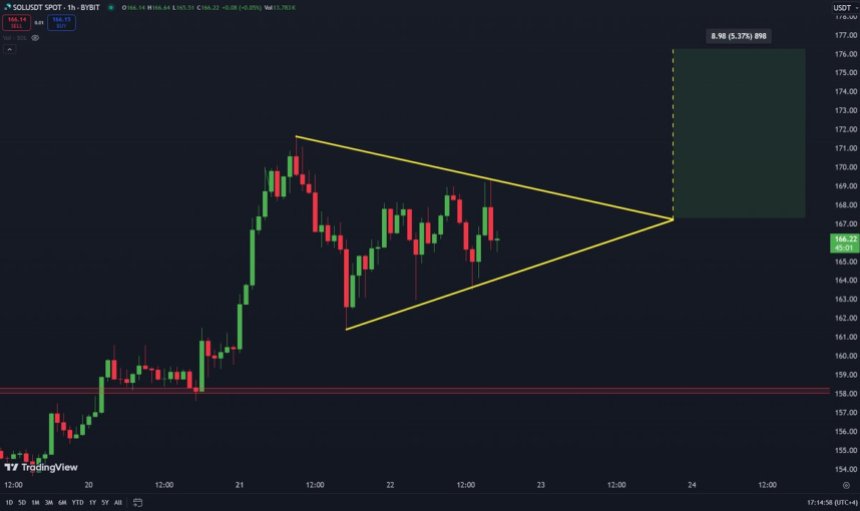
Top analyst Carl Runefelt recently shared a technical analysis suggesting a potential surge for SOL in the coming days, with a target of $176. His analysis highlights key bullish patterns, but concerns about the broader market correction could drag Solana down if the correction intensifies.
With the market in flux, the next few days will be crucial for SOL. Investors watch closely for signs of strength or weakness that could influence the price action. While optimism remains for a potential surge, caution is warranted as the market correction unfolds.
Solana Testing Previous Supply As Demand
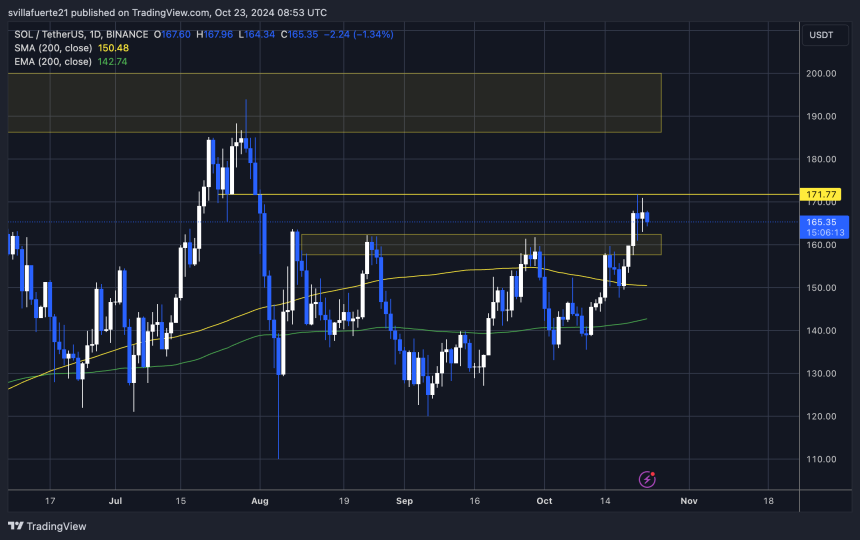
Solana is currently at a critical level, holding strong above $160, a price that had previously acted as resistance since early August. SOL has broken above this level and found support, so it signals a potential shift in the monthly trend that has kept the price suppressed. Investors are watching closely to see if this shift will lead to continued bullish momentum.
Crypto analyst and investor Carl Runefelt recently shared a technical analysis on X, offering insight into Solana’s short-term outlook. He revealed a 1-hour chart showing a symmetrical triangle, a bullish pattern often preceding strong price movements.

The upper line of this triangle sits around $168, and Runefelt suggests that if SOL manages to break above this level, the next target would be $176. This would mark a significant push to new local highs, further solidifying Solana’s bullish trend.
As Solana continues to hold above $160, the market is waiting. Investors are exercising patience and are aware that the next few hours and days could be pivotal for SOL’s price action.
If the bullish pattern materializes and the price breaks out, it could lead to a significant rally. However, until that breakout occurs, traders are cautious, knowing that short-term volatility could still impact Solana’s performance.
Technical Levels To Watch
Solana is currently trading at $165 after facing a rejection from the $171 mark, a key resistance level that may hold the price down for a few days or weeks. Despite this setback, SOL has shown resilience, rebounding strongly from the daily 200 moving average (MA) at $150 and successfully breaking past the $160 resistance. This breakout is a significant development, signaling a potential upside once the broader market begins pushing up again.

Holding above the $160 level is crucial for SOL, reflecting investor confidence and signals strength in the price action. Holding this support level would signal optimism about Solana’s ability to rally and reach new yearly highs in November.
The coming days will determine whether SOL can keep bullish momentum or if a prolonged consolidation below $171 is in. Investors are closely watching for signs of strength and a continued push higher.
Featured image from Dall-E, chart from TradingView
#Solana, #Sol, #SolanaBullish, #SolanaDemand, #SolanaNews, #SolanaPrice, #SolanaPriceAnalysis, #SolanaTechnicalAnalysis, #SOLUSDT