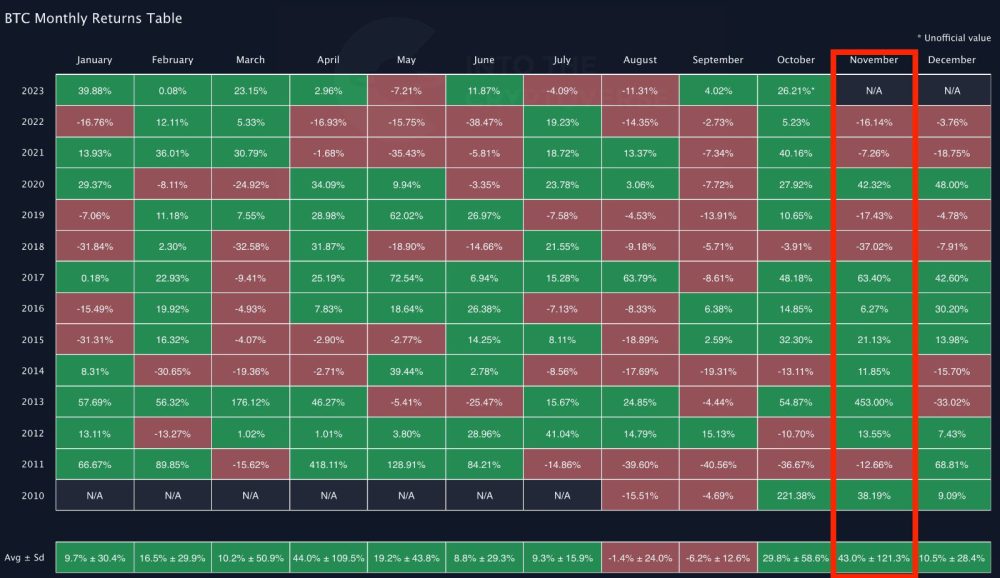
November has often been a standout month for Bitcoin, with historical data indicating an impressive average price jump of 43%. This would propel Bitcoin to around $48,000. But with October already showing a significant price increase, the question arises: Will Bitcoin continue its bullish trend, or is a retrace on the horizon?
November Monthly Returns
November has been particularly bullish for Bitcoin over time, with an average of 43% of price increases over the years. If this trend holds true for this year, we might see Bitcoin touching $48,000.
Related Reading: Bitcoin Price To Reach $170,000 in 2025 – Mathematical Model Predicts
However, it’s worth noting that this very high average is significantly influenced by the extreme 453% surge in 2013. If we exclude this outlier, the average settles around 11.54% This leads to a more conservative forecast, pointing to a potential rise to around $38,000.

Diving deeper into historical data, 8 of the past 13 years have shown price increases in November, making another increase this month seem plausible. Yet, a closer look reveals that 4 of the last 5 times in November there was a price dip.
In 2022, the FTX collapse played a pivotal role and 2021 marked the peak for Bitcoin, suggesting that these decreases might be outliers rather than indicative of a changing trend.
For a closer comparison, 2019 stands out as it too was a pre-halving year, just like 2023. That year, after a promising October, Bitcoin saw a 17% dip in November, which would equate to a value of $28,000 if repeated this year.
Bitcoin Price Action In 2023
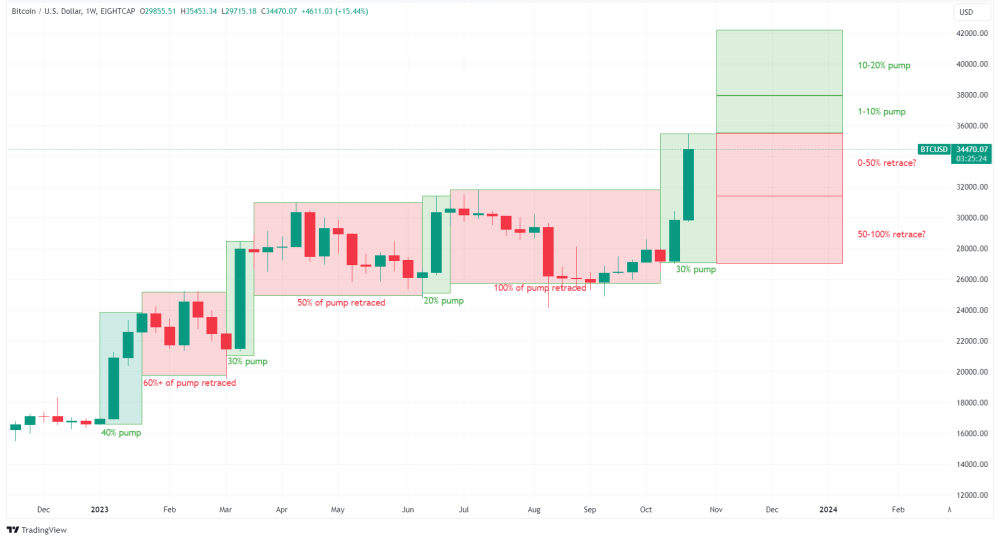
Through 2023, Bitcoin has demonstrated a recurring behavior following significant price increases of more than 20%. Typically, these surges have been followed by consolidation periods, and subsequently, a retrace to at least half of the initial increase.
Related Reading: Bitcoin Season: Leading The Charge In The Crypto Market
Take January, for instance. Bitcoin’s price increased from $16,500 to $24,000, only to decline to $20,000 by March – a retrace of 60% from the initial increase.
One particularly extreme example was in August when Bitcoin retraced the entirety of a prior 20% rise.

It’s noteworthy that these retraces haven’t always been immediate. After the rise in March, it wasn’t until June – a span of three months – that the price saw a 50% retrace. On average, this year’s price retraces have taken between 1 to 3 months to manifest post-rise.
Furthermore, before any retrace occurs, there’s still room for additional upside. To illustrate, after the aforementioned March rise, Bitcoin experienced an additional 10% increase before eventually retracing the initial surge.
Potential Scenarios For November Using the above, potential scenarios for November are listed below:- Very bullish scenario: Bitcoin rises by 10-20%, potentially reaching up to $42,000.
- Bullish scenario: Bitcoin rises by 1-10%, potentially reaching up to $38,000.
- Bearish scenario: Bitcoin decreases by 10%, dropping to around $31,000. This would mean a 50% retrace of the surge in October.
- Very bearish scenario: Bitcoin decreases by 20%, dropping to around $28,000. This would mean a 100% retrace of the surge in October.
#BitcoinNews, #Bitcoin, #BitcoinPrice, #BitcoinPriceAnalysis, #Btc, #BtcPrice, #Btcusd, #BTCUSDT, #Xbt, #Xbtusd