In a recent analysis, James Coutts, Chief Crypto Analyst at Realvision, signaled a potential bullish turn in Bitcoin’s near future, attributing the forecasted change to shifts in global liquidity measures, specifically the Global Money Supply (M2) index which is widely seen as most important price catalyst. Coutts detailed this anticipation in a thread on X, where he examined the relationship between major economic indicators and Bitcoin’s price cycles.
Global Money Supply And Its Correlation With Bitcoin
Coutts’ analysis begins with the M2 money aggregates, which consist of cash, checking deposits, and easily convertible near money. He tracks these aggregates across the 12 largest economies, all adjusted to USD. This measure, he suggests, is central to understanding liquidity flows within the global fiat, credit-based financial system. According to Coutts, “The money stock often moves in one direction, with significant drops like those seen in 2022 being rare and typically brief.”
Currently, the Global M2 is neutral, but Coutts predicts imminent changes: “There is a sea of red across my macro & liquidity dashboard, but signs are emerging that this is about to change. Global M2 holds the key for the next leg of the cycle due to its high correlation with $BTC bull cycles.”
The rate of change in M2 money supply is more critical than its nominal value. Coutts noted, “The chart confirms what our MSI performance table suggests: Bitcoin usually moves with shifts in M2 momentum.” He explained that despite the global money supply MSI indicator being in an uptrend, the momentum remains sluggish, maintaining a Neutral MSI. For a shift to a bullish MSI signal, an increase in momentum is necessary, requiring a combination of dollar depreciation, credit expansion, and increased government debt issuance.
Coutts pointed out the crucial role of credit conditions, as evidenced by corporate bond spreads (BBB/Baa) compared to the US 10-year Treasury yield, which have historically aligned with significant inflections in Bitcoin’s cycle. “These spreads are currently narrowing, indicating that corporations are managing to issue and roll over debt despite the high interest rates resulting from the record hikes in 2022 and 2023,” he observed.
Using the chameleon trend indicator on the corporate spread index, Coutts suggests a strategy: “Long Bitcoin when the index shows a bearish trend (red) and stay alert for potential trend reversals (turning green).”
The Role Of the Dollar And Future Outlook
A key to this cycle, according to Coutts, is the behavior of the DXY (Dollar Index), which measures the US dollar against a basket of foreign currencies. “The Dollar is range-bound. A break below 101 would be rocket fuel for Bitcoin,” he asserted, emphasizing that market sentiment on liquidity is often reflected in real-time by DXY movements.
Coutts also touched upon the US debt situation, suggesting that without a conservative shift in Congress advocating for fiscal responsibility, more deficit spending is likely on the horizon, which could further influence liquidity conditions favorable to Bitcoin.
Coutts concluded with a note of caution mixed with optimism: “While my framework needs 2/3 MSI indicators to turn Bullish for macro headwinds to turn into tailwinds, Bitcoin price action will probably sniff out this inflection in the macro before most indicators react.”
His analysis suggests that if Bitcoin breaks above its all-time highs, it would be unwise to bet against it, anticipating potential climbs towards $150,000 in this cycle. “The DXY holds the key to the Bitcoin cycle as it prices in mkt expectations on liquidity in real time. And liquidity is coming. Watch the 101/102 level on DXY If that breaks, then we should see ~$150k btc this cycle,” he remarked.
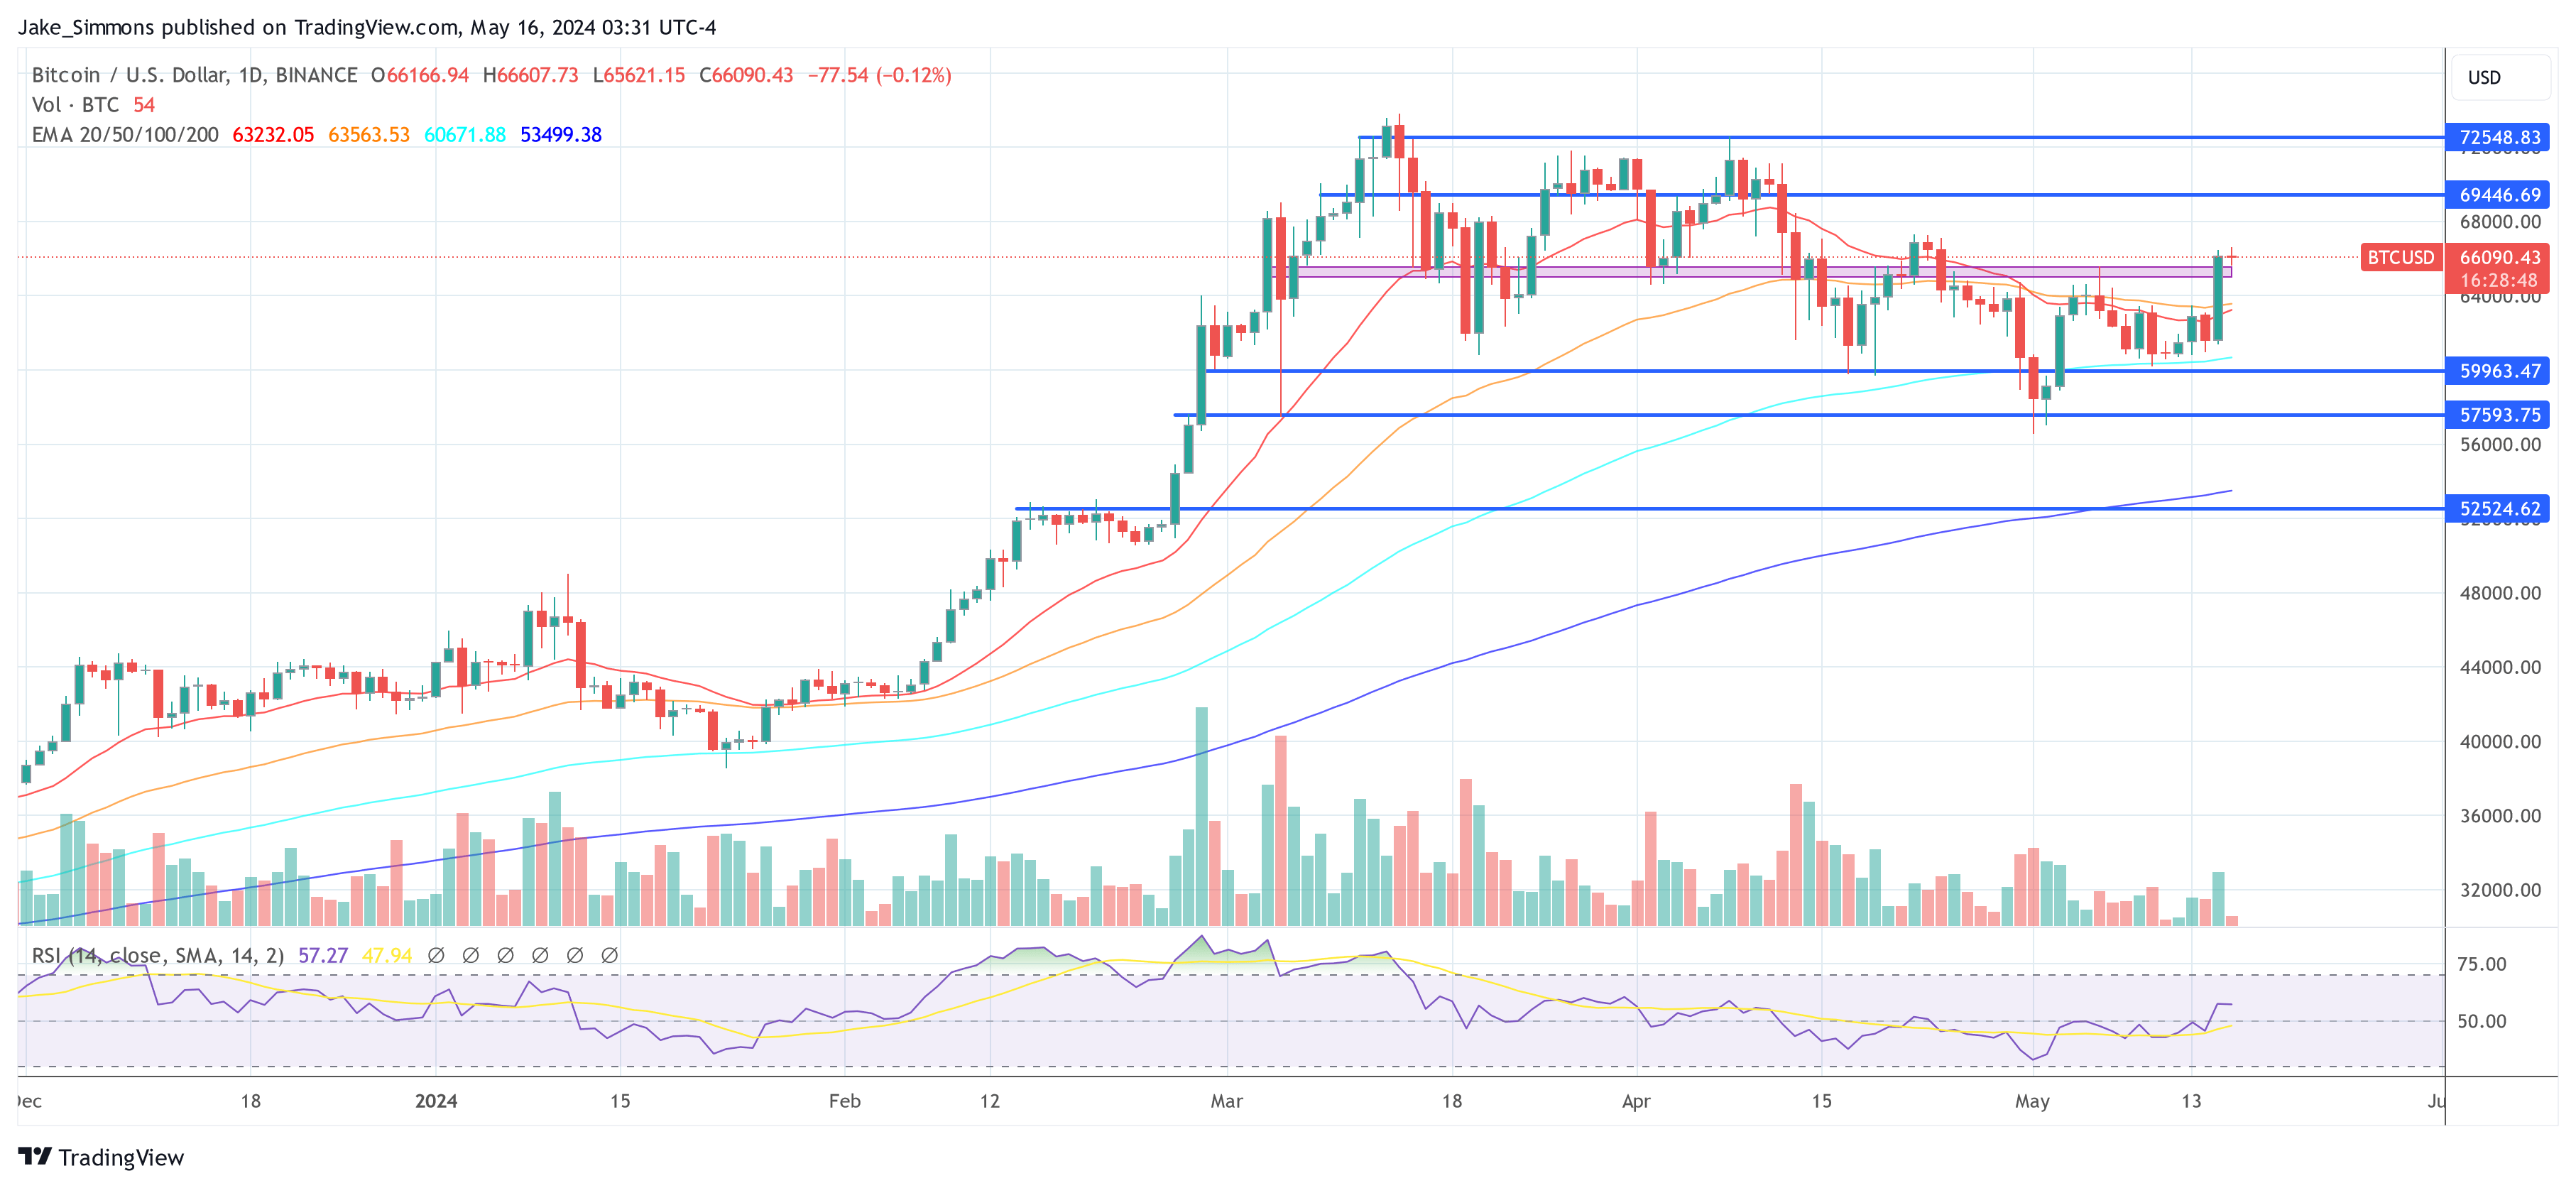
At press time, BTC traded at $66,090.

#Bitcoin, #Bitcoin, #BitcoinNews, #BitcoinPrice, #BitcoinPriceAnalysis, #Btc, #BtcPrice, #Btcusd