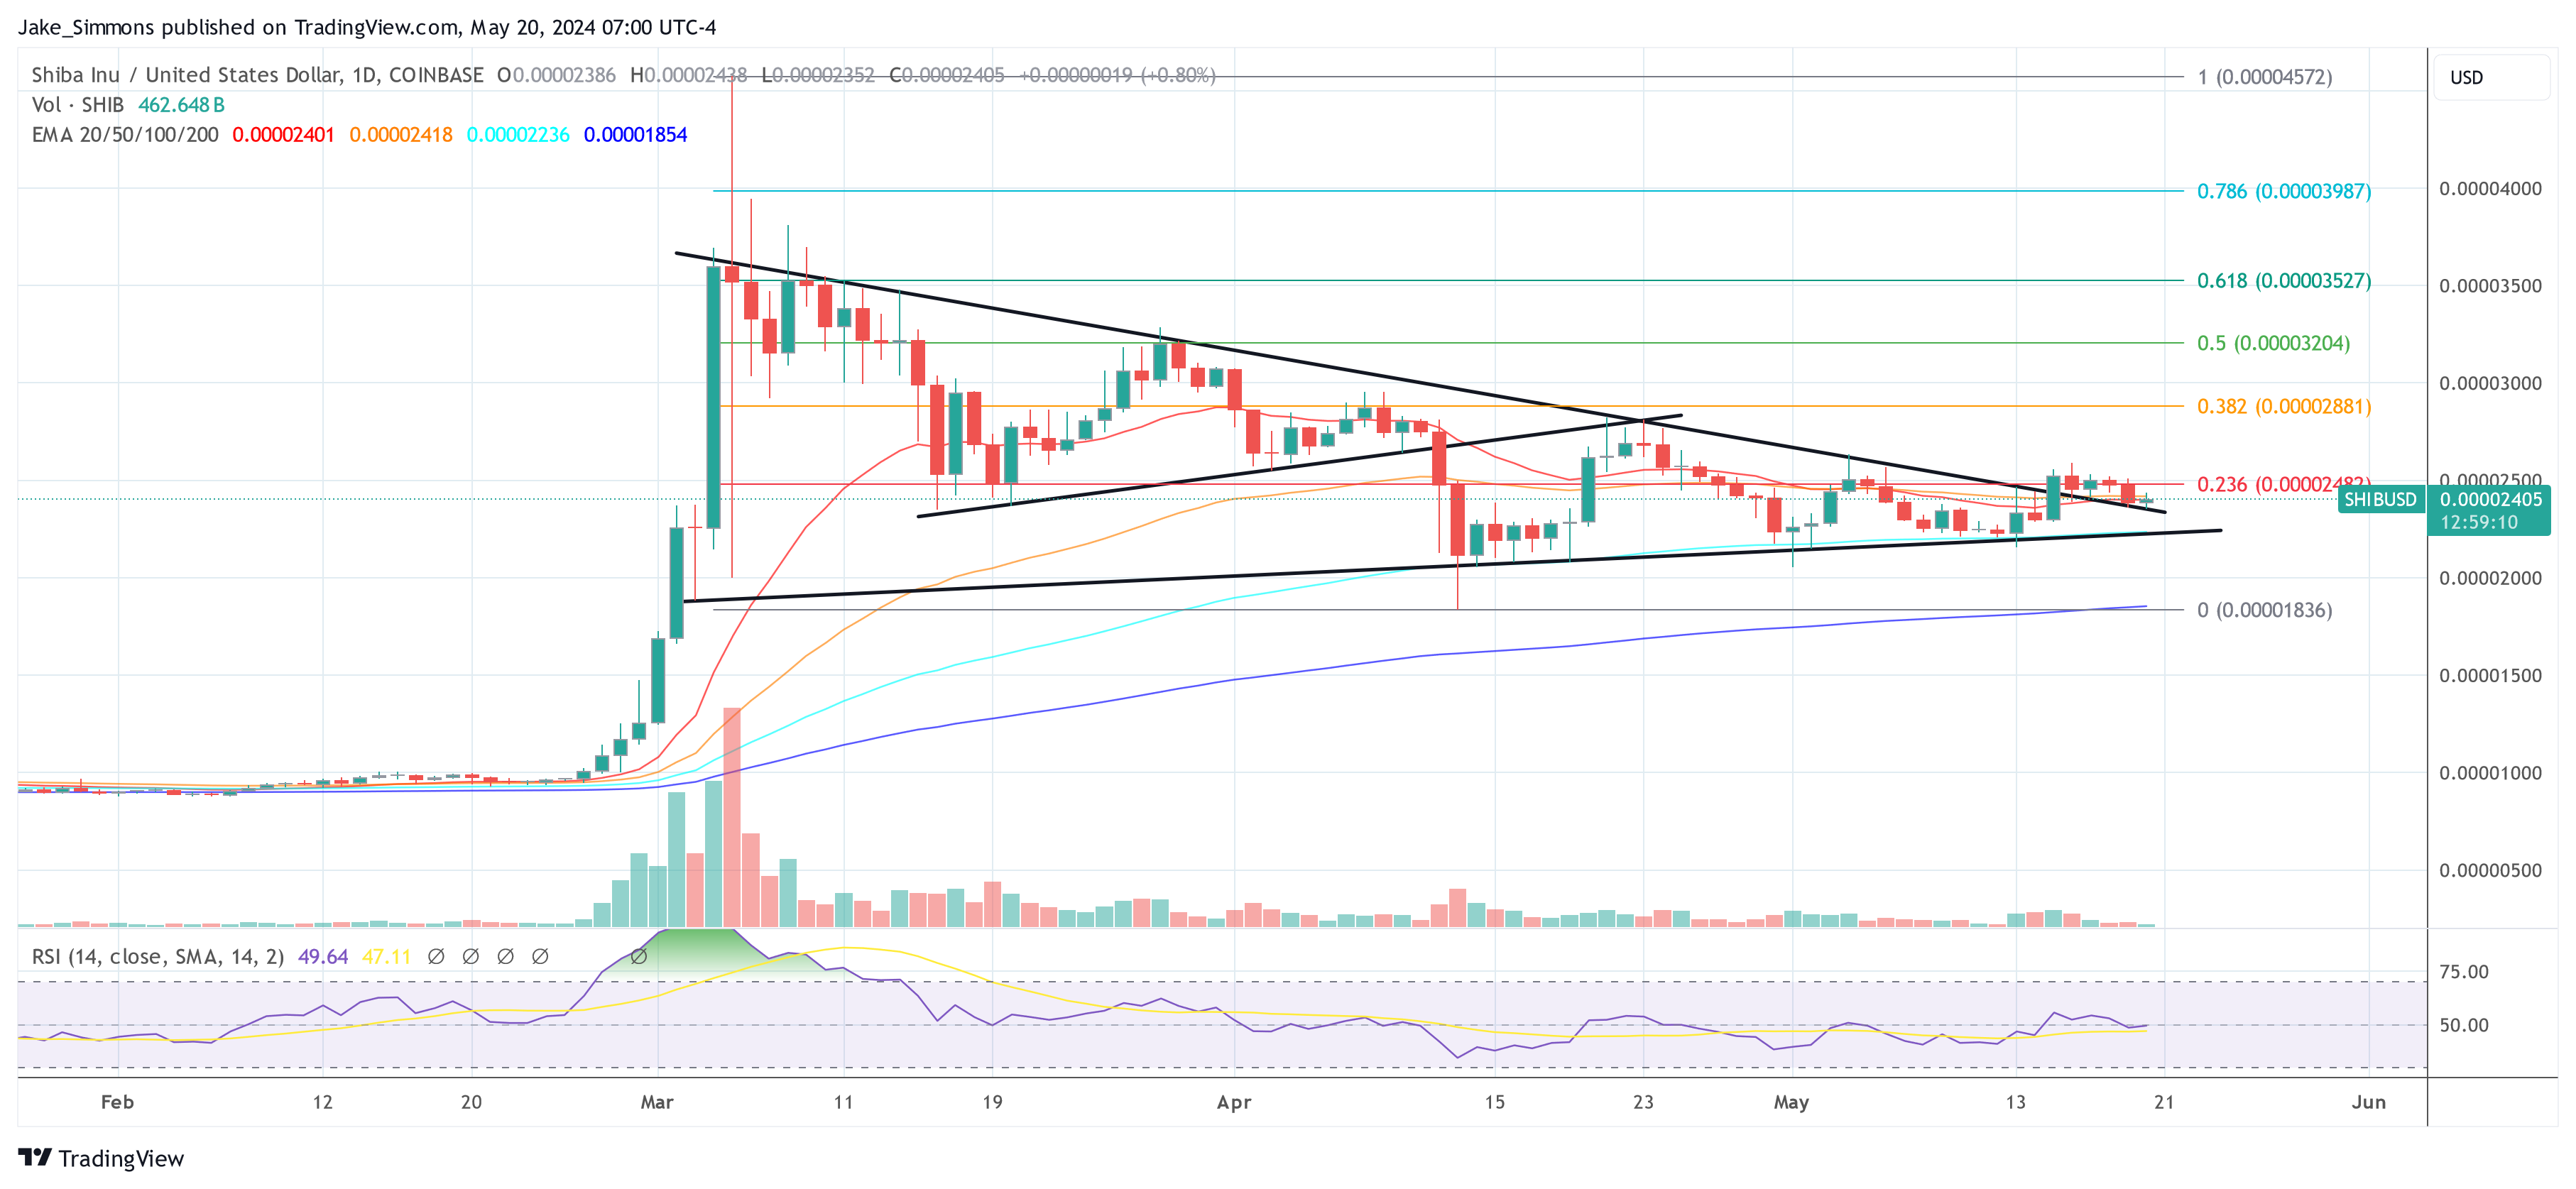
Last week, Shiba Inu (SHIB) emerged from a bull pennant formation on its daily chart, signaling the potential for a significant price increase. Currently, SHIB’s price is at a critical juncture as it undergoes a retest of the breakout level. If this retest is successful, it could lead to considerable gains.
Shiba Inu Price Could Double If This Happens
The bull pennant is a continuation pattern that typically signifies a strong uptrend following a period of consolidation. In the daily chart, SHIB/USD showcases a classic bull pennant formation. This pattern consists of two converging trend lines forming a small symmetrical triangle, following a significant price increase. The pole of the pennant represents the initial sharp rise from late February to early March, while the pennant itself formed from March through May.

The upper trendline of the pennant acted as resistance multiple times, while the lower trendline provided support just as often. The breakout above the upper trendline occurred on Wednesday last week, and SHIB is currently in a retest phase. This retest is crucial to confirm the validity of the breakout. A successful retest, where the price finds support at the upper boundary of the pennant, could signal a strong continuation of the prior uptrend.
The key price level to watch is currently around $0.00002350. Further important price levels to monitor include the resistance levels at $0.00002482, which coincides with the 0.236 Fibonacci retracement level, and the next resistance levels at $0.00002881, $0.00003204, $0.00003527, and $0.00003987. These levels represent the 0.382, 0.5, 0.618, and 0.786 Fibonacci retracement levels, respectively, and are critical targets if the uptrend continues.
On the support side, the immediate level to watch is $0.00002220, which aligns with the recent pennant’s lower boundary. Further support can be found at the 200-day EMA, currently at $0.00001854, and the 0 Fibonacci retracement level at $0.00001836, marking the lowest point of the recent consolidation phase.
Moreover, the 20-day EMA at $0.00002399 and the 50-day EMA at $0.00002418 are crucial for SHIB as they present the next resistance levels. SHIB is currently trading slightly above its 20-day EMA but below the 50-day EMA, indicating mixed short-term momentum.
The Relative Strength Index (RSI) stands at 48.74, close to the neutral 50 mark, suggesting that SHIB is neither overbought nor oversold. This neutral stance provides room for potential upward movement without being hindered by overbought conditions.
Volume analysis shows a gradual decline during the pennant formation, which is characteristic of this pattern. A significant increase in volume upon a successful retest would be a strong confirmation of the bull pennant. The recent breakout and the current retest phase are critical to watch. A successful retest with increased volume would likely validate the bull pennant pattern and signal the continuation of the uptrend.
Potential price targets for SHIB based on the bull pennant, assuming a successful breakout and continuation of the bull pennant pattern, can be estimated based on the height of the initial flagpole. The flagpole, representing the initial sharp rise from approximately $0.00001 to $0.000036, gives a height of around $0.000026. Adding this to the breakout point at $0.00002436, the target price for SHIB is approximately $0.00005036.
#ShibaInu, #SHIB, #SHIBPrice, #ShibaInuNews, #ShibaInuPrice, #ShibaInuPriceAnalysis, #ShibaInuPricePrediction