Cardano (ADA) has made a strong comeback, with bulls stepping in to reverse the recent pullback and drive a fresh rally. After a brief period of downward pressure, the cryptocurrency is gaining traction once again, sparking renewed optimism among traders and investors.
With positive momentum building, Cardano is showing signs of further upside movement, positioning it for continued gains toward the $0.4233 mark. The question now is whether bulls can sustain this surge and push ADA toward new highs.
As the uptick progresses, this article aims to analyze ADA’s recent price movement, with a focus on how the bulls reversed the pullback and sparked a new rally. It will examine the current bullish path, evaluate key support and resistance levels, and explore the potential for sustained upward movement in the near term.
Bullish Momentum Returns: How Cardano Reversed The Pullback
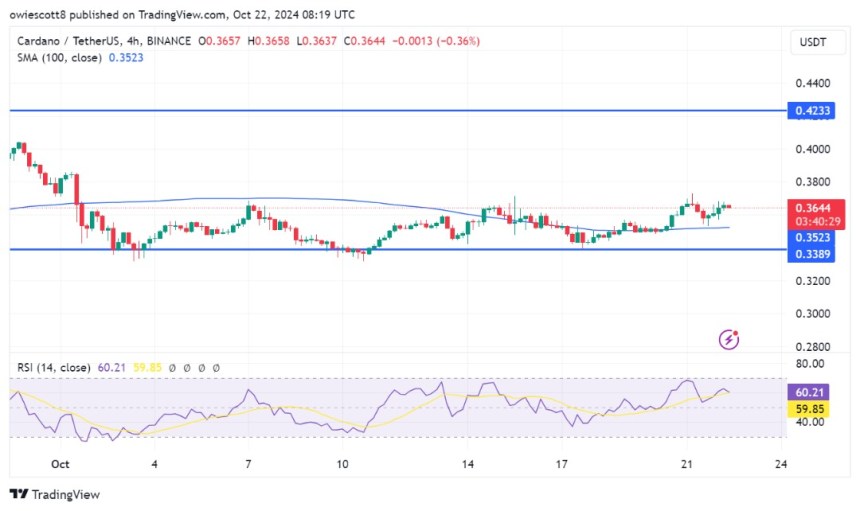
On the 4-hour chart, Cardano has turned bullish, currently holding its position above the 100-day Simple Moving Average (SMA) printing multiple green candlesticks. As long as the price remains above this level, the bulls will likely maintain control, with the possibility of further gains if the upward trend persists.

An analysis of the 4-hour Relative Strength Index (RSI) reveals a notable surge, rising to 63% after previously dipping to 53%. This increase reflects growing bullish momentum, suggesting that buying pressure is gaining strength in the market. While the current level is still below overbought territory, the upward shift in RSI signals increased demand and could pave the way for additional upside.
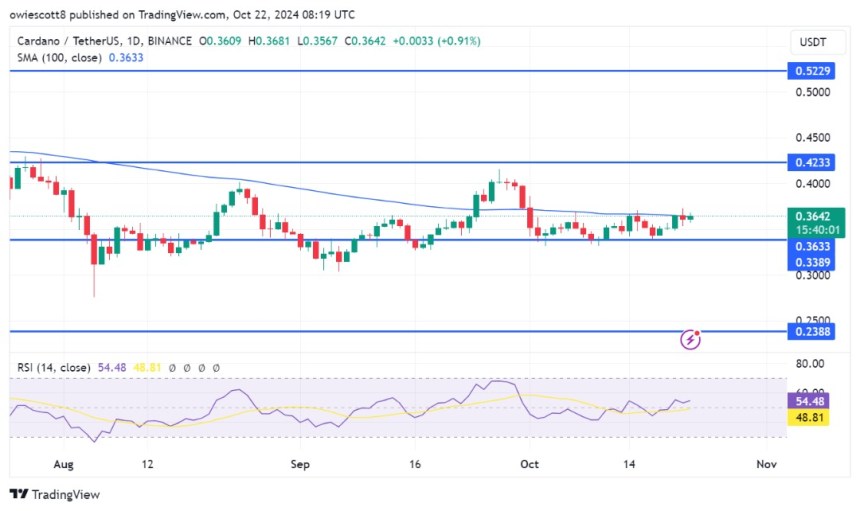
Also, the daily chart shows that Cardano is actively trying to break above the 100-day SMA, a key resistance level. Successfully surpassing this SMA could indicate a stronger optimistic trend and boost investor confidence, attracting more buyers. If ADA clears this resistance, it may lead to a shift in market sentiment and more upward movement.

The RSI on the daily chart is currently at 53%, indicating a bullish trend for ADA, as it is above the critical 50% threshold. Typically, this suggests that buying pressure is outpacing selling pressure, reflecting strong momentum and growing trader optimism about ADA’s price potential.
Support And Resistance Levels To Watch In The Coming Days
On the upside, the $0.4233 resistance level is critical, as a successful breakout above this point could signal a stronger uptrend and draw in more buying interest. Should ADA surpass $0.4233, the next significant resistance to monitor will be at $0.5229. Clearing this level further bolsters bullish pressure, potentially leading to even higher price targets as market sentiment shifts favorably.
Meanwhile, on the downside, the first support level to monitor if the bulls are unable to maintain their momentum is $0.3389. A break below this level could result in additional losses, possibly driving the price toward the next support level at $0.2388, which may further extend to lower support zones if selling pressure continues.
#ADA, #Adausd, #ADAUSDT, #Cardano, #RelativeStrengthIndex, #RSI, #SimpleMovingAverage, #SMA