Bitcoin has reached a critical juncture in its current market cycle, according to a recent analysis conducted by on-chain analytics firm Glassnode. The data reveals striking similarities to historical patterns, raising questions about the potential emergence of a familiar phenomenon: the re-accumulation period.
A Resilient Market: Bitcoin Holds Firm At Mid-Cycle
The Glassnode analysis reveals that Bitcoin is consolidating around the $30,000 mark, which acts as a significant mid-point within the 2021-2023 cycle. The historical significance of this level is not to be overlooked, as it has been tested repeatedly in previous cycles.
Remarkably, the mid-cycle phenomenon is not exclusive to the current cycle; similar mid-cycle points were observed in both 2013-2016 and 2018-2019, displaying analogous supply dynamics.

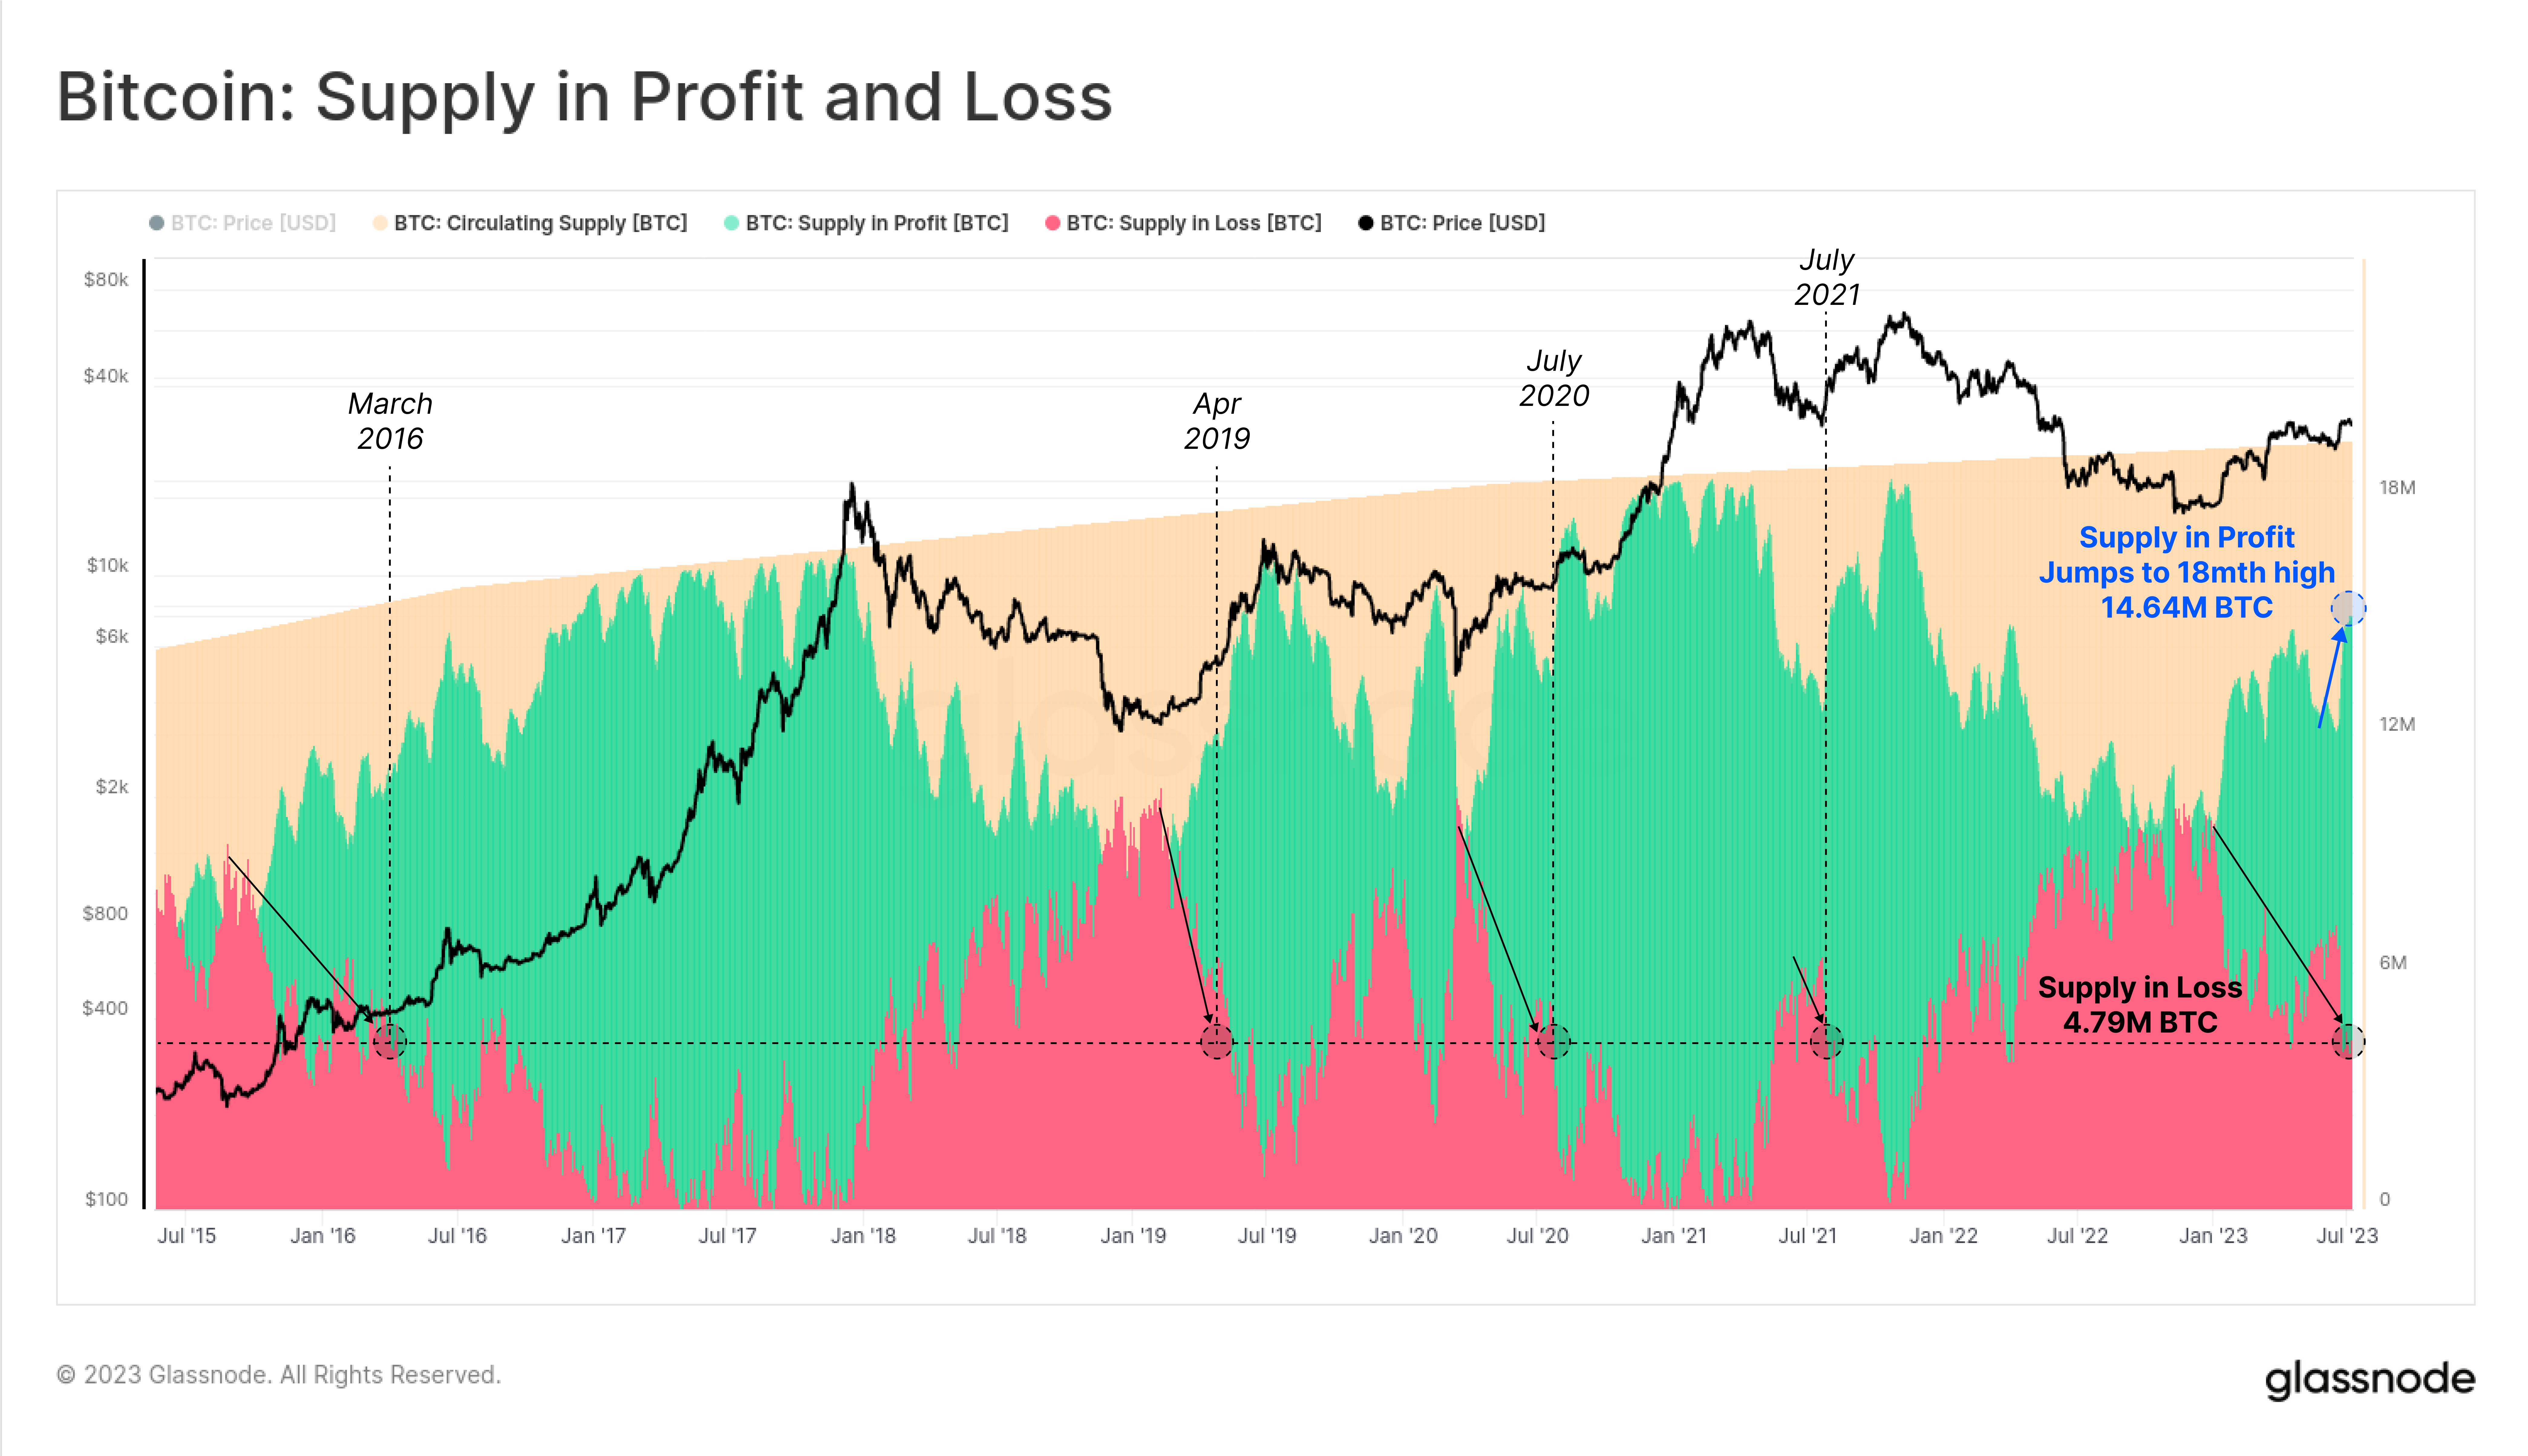
As Bitcoin currently hovers around the $30,000 mid-point, approximately 75% of the total supply is currently held in a profitable state, while the remaining 25% remains in a loss position. This balance of supply held in profit versus loss is reminiscent of equilibrium points witnessed during previous cycles, indicating a potential re-accumulation period.
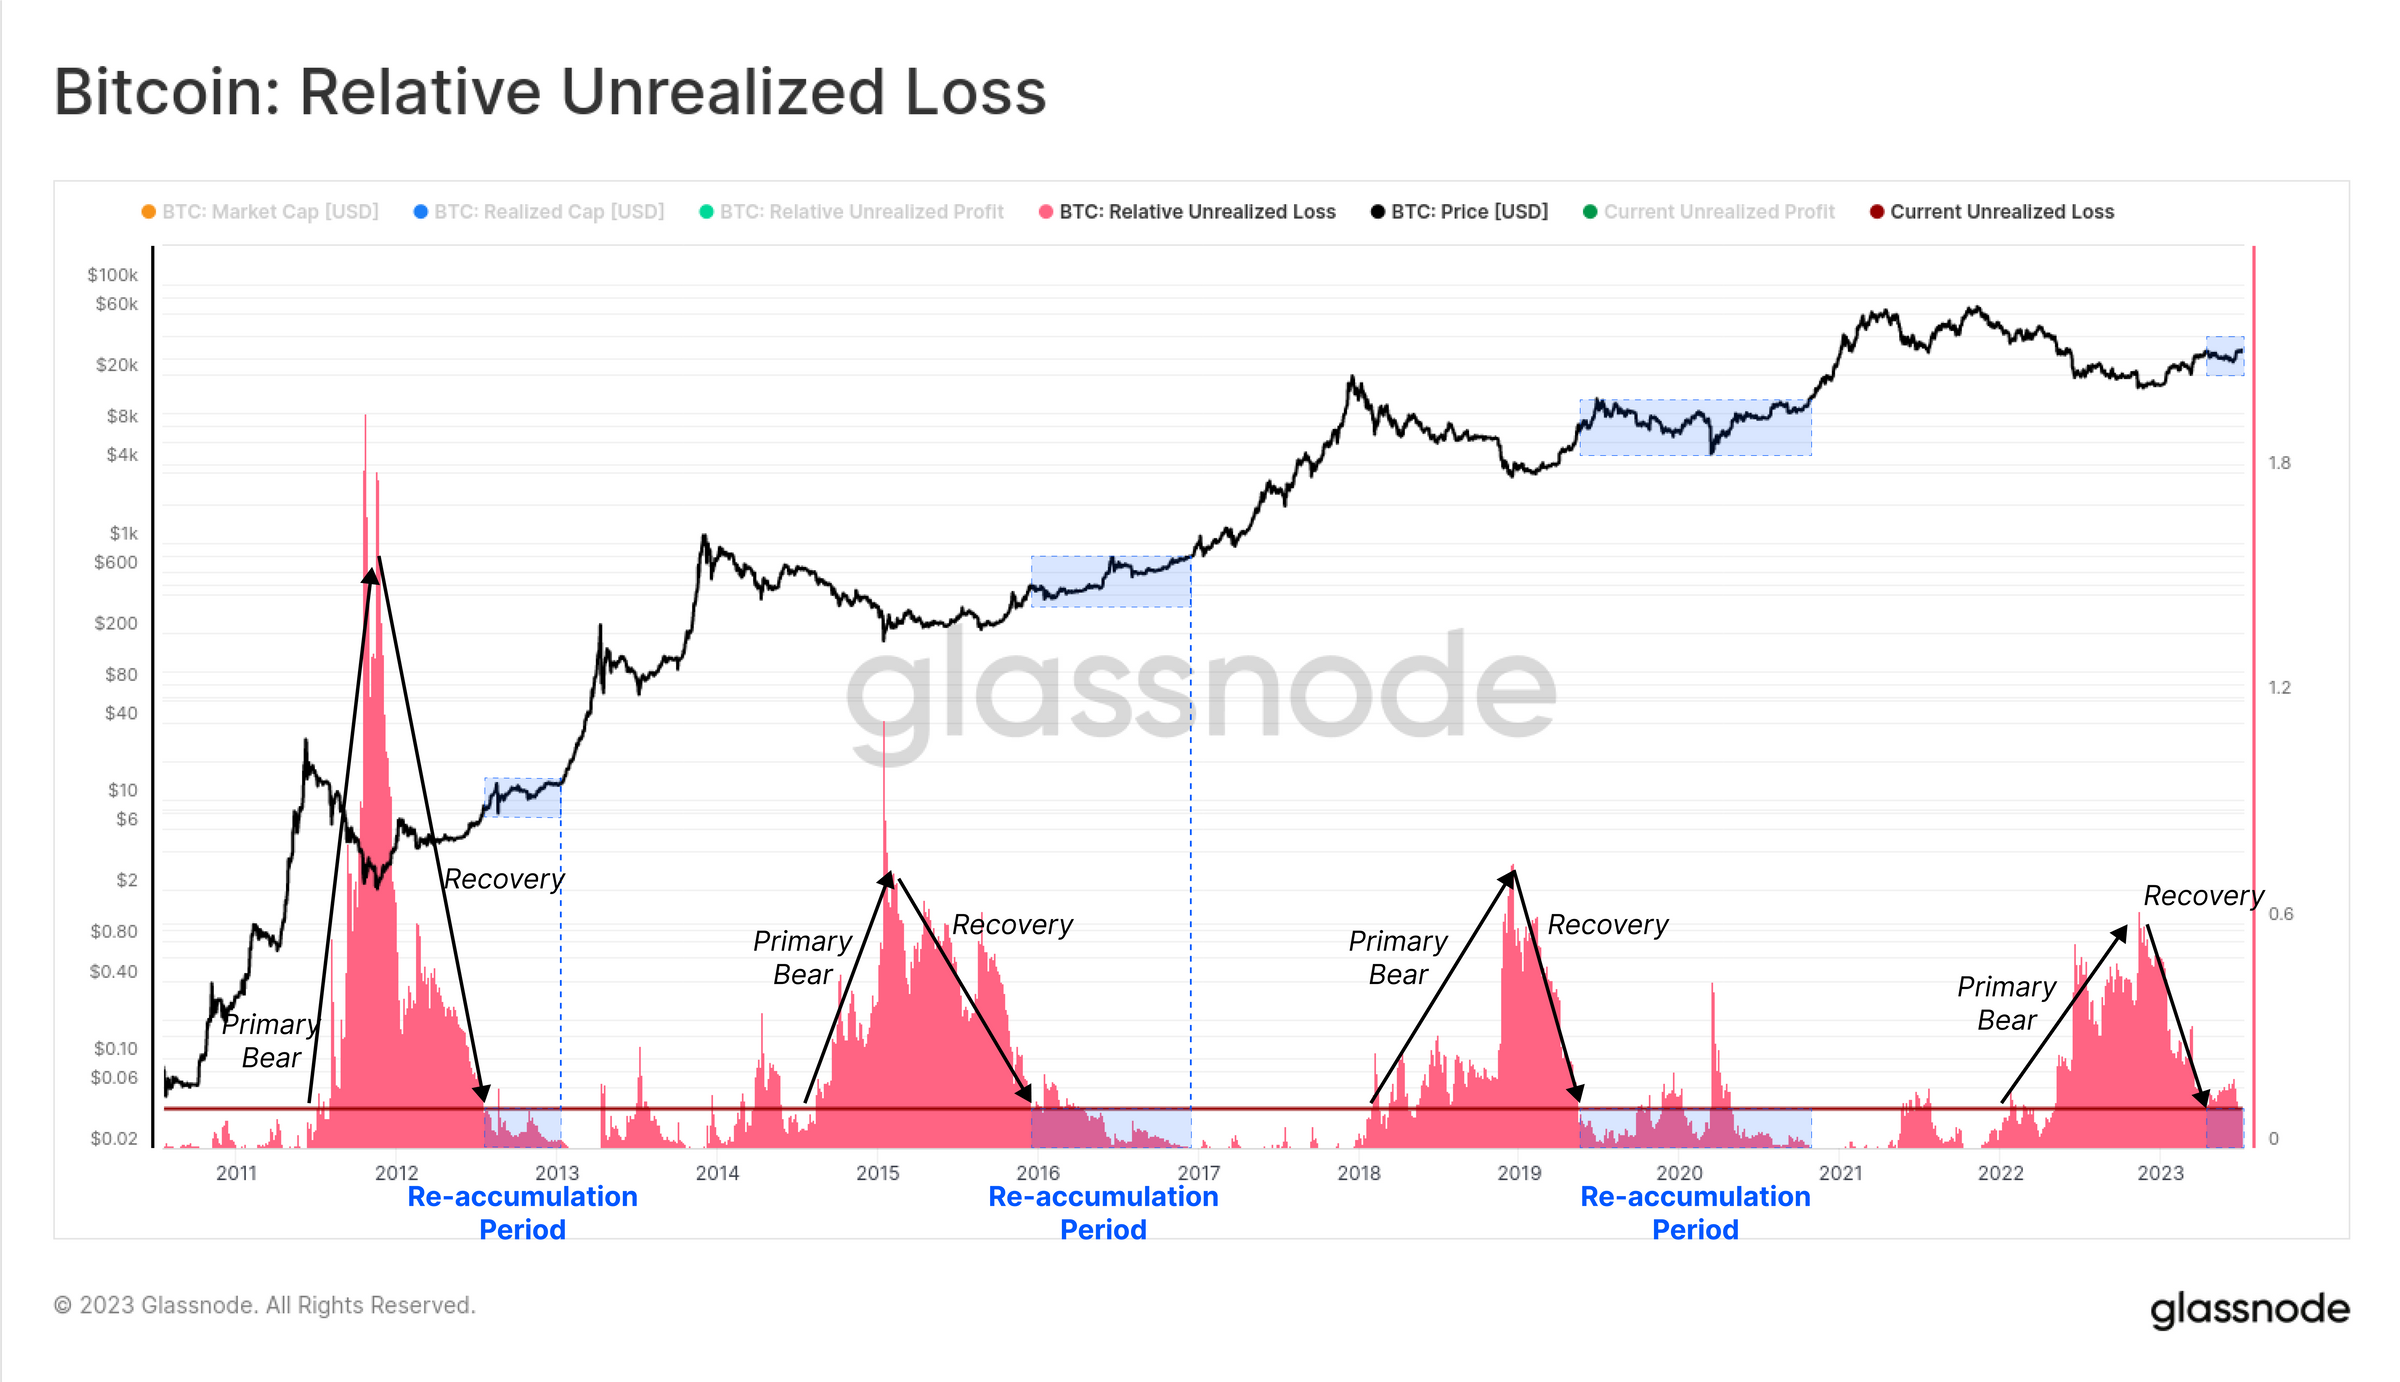
As Glassnode explains, “This 75:25 balance of supply held in profit:loss is the equilibrium point for Bitcoin. 50% of all trading days have seen a higher Profit-to-Loss balance, and 50% a lower one.” Such equilibrium points have historically required time for the market to digest and re-consolidate around, often accompanied by a period of sideways trading and volatility. This has become known as the “re-accumulation period.”
At the moment, The supply held “in-loss” has declined to just 4.79 million BTC, reaching similar levels seen in July 2021 ($30k), July 2020 ($9.2k), April 2016 ($6.5k), and March 2016 ($425).

Robust Recovery And Historical Comparisons
According to Glassnode, Bitcoin’s price performance in 2023 has demonstrated remarkable resilience, with a maximum drawdown of only -18% thus far, a shallow correction compared to previous cycles. This suggests a substantial underlying demand for the asset and indicates a potential strong degree of investor support.
Glassnode’s analysis further highlights the similarities between the current recovery rally and those observed in prior cycles. Historically, recovery rallies following a similar magnitude move off the cycle’s bottom often marked the genesis of a new cyclical uptrend.
While exceptions exist, the parallels between the current recovery and those of the past offer an intriguing possibility for Bitcoin’s future trajectory. The report notes, “With the exception of 2019, all prior cycles which experienced a similar magnitude move off the bottom were, in fact, the genesis point of a new cyclical uptrend.”
Remarkably, previous re-accumulation periods were characterized by a lack of macro market direction and tending to trade sideways. “With the market back at this equilibrium point, it remains to be seen if a similarly lengthy and choppy process is needed to overcome it,” concludes Glassnode.

The Takeaway: Will History Repeat For BTC?
Glassnode’s analysis unveils a fascinating narrative within Bitcoin’s ongoing market cycle. The emergence of the mid-cycle point and the familiar supply dynamics indicate that historical patterns are repeating themselves. While no crystal ball can predict the future with certainty, these insights offer intriguing possibilities for Bitcoin’s trajectory.
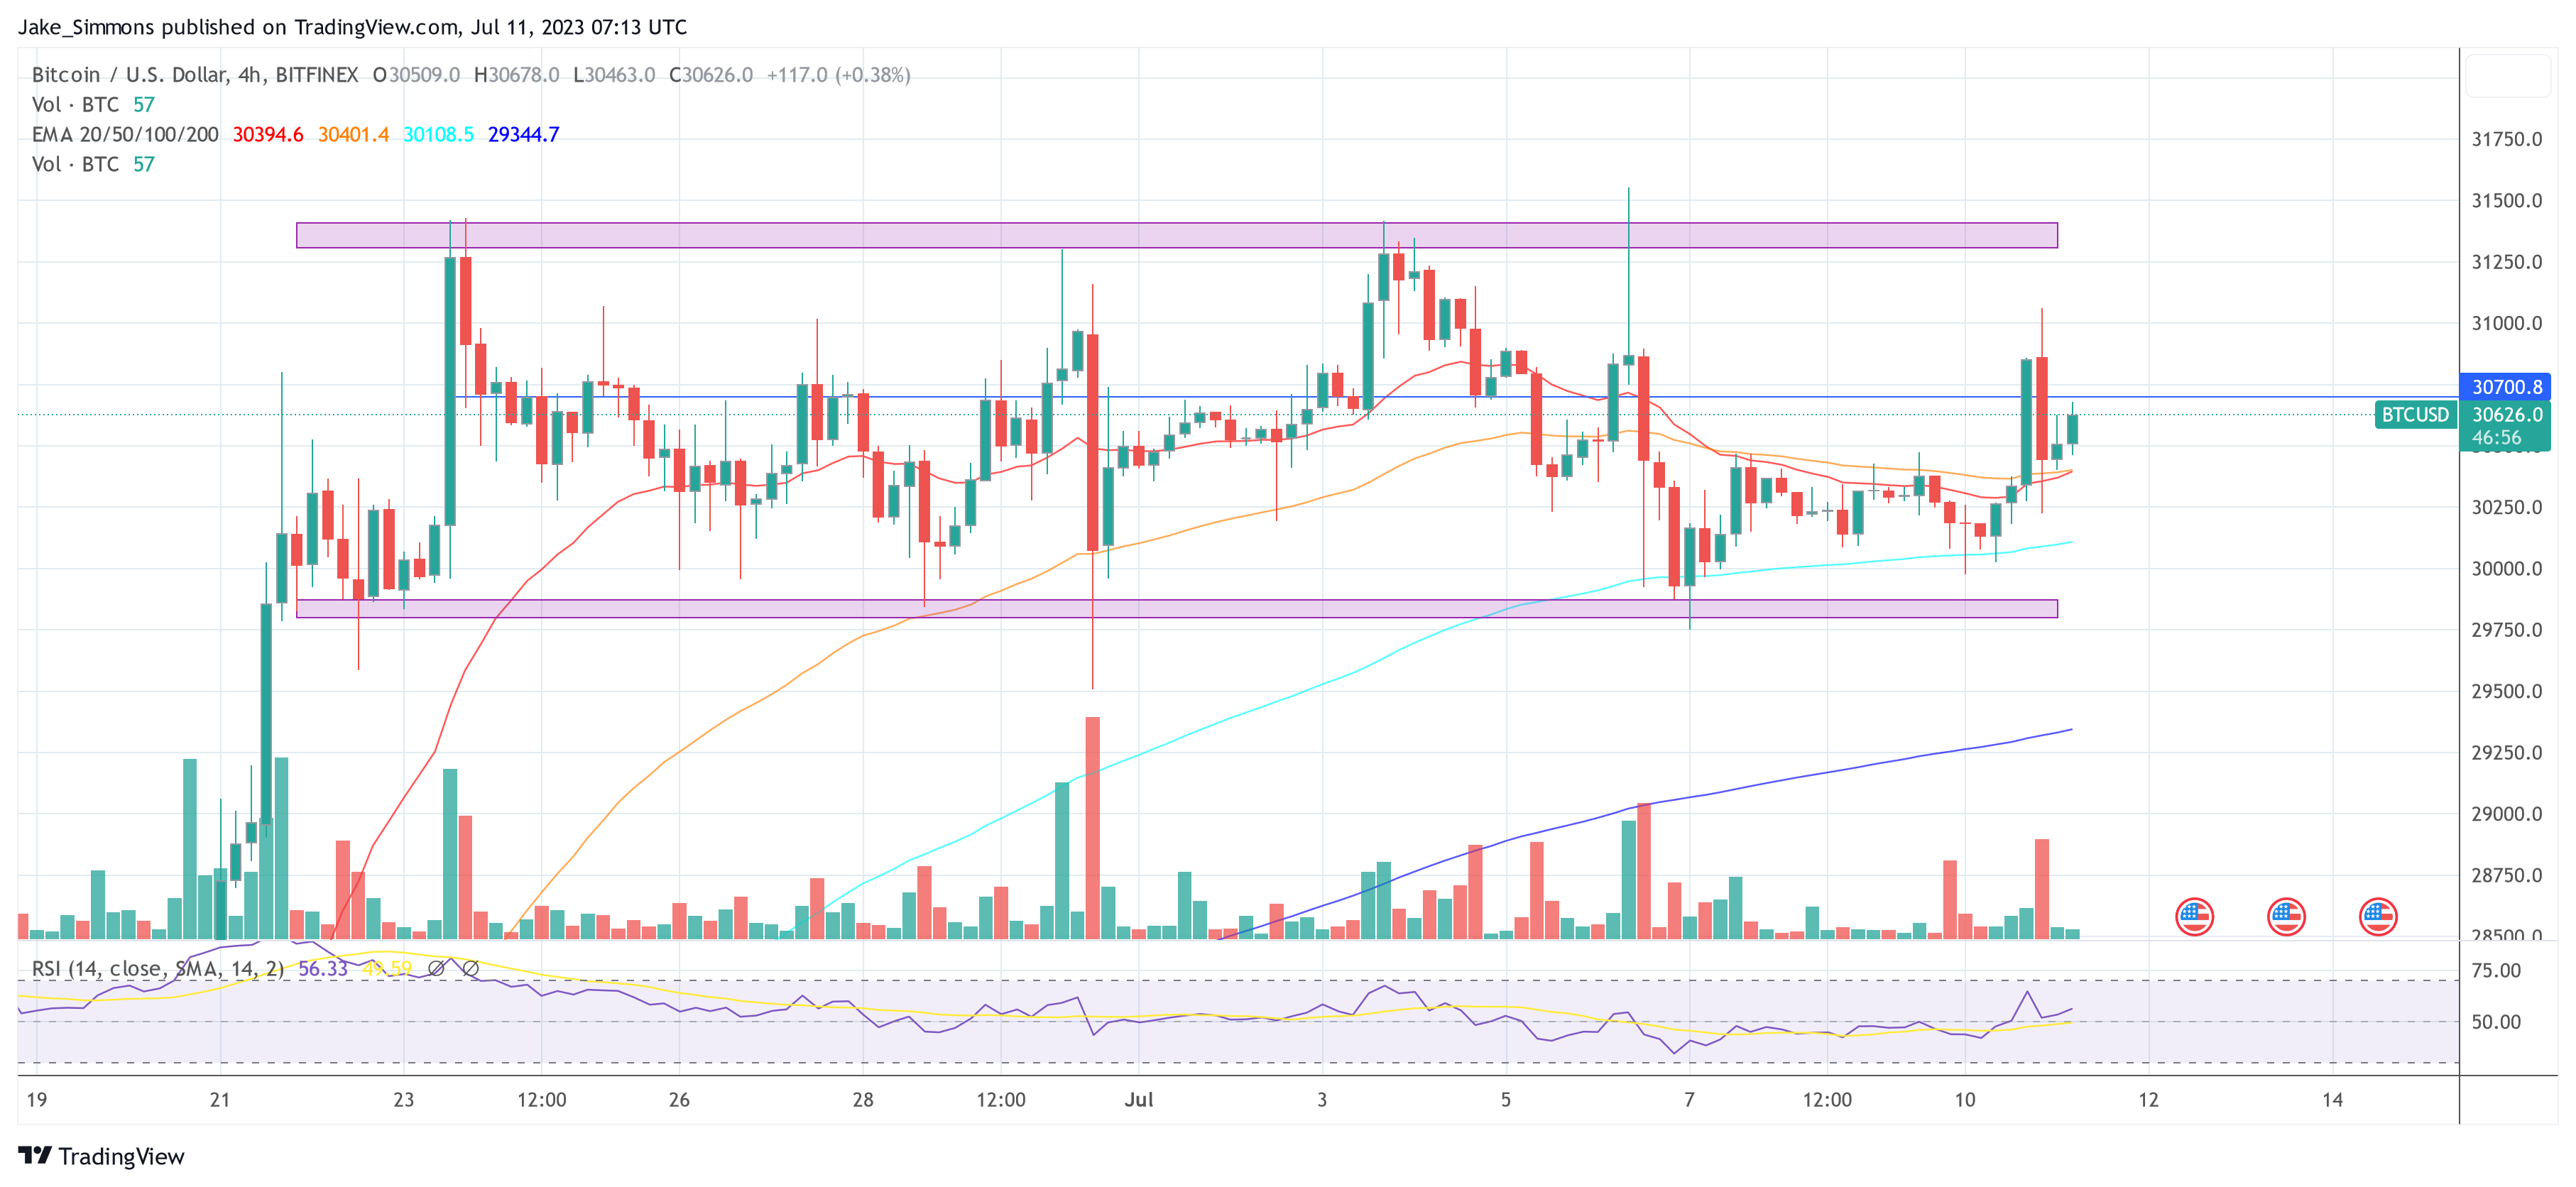
At press time, the BTC price was at $30,626 and remained in the trading range of the last two weeks.
