WIF is making a powerful return to the market, as bullish momentum takes hold and drives the price higher. After showing signs of resilience, the digital asset is on an upward trajectory, with strong positive traction setting the stage for further gains. As WIF continues to gain ground, the digital asset is positioning itself for continued growth, pushing past key resistance levels.
This article aims to analyze WIF’s current strength, which is propelling the asset toward higher price levels. The goal of examining the key drivers behind this surge, including market sentiment, and technical indicators, is to understand how the meme coin is positioning itself for sustained upward movement. It will also explore the potential for the asset to break through significant resistance points and set new highs while assessing the durability of the rally.
WIF’s Bullish Traction: Analyzing The Path Forward
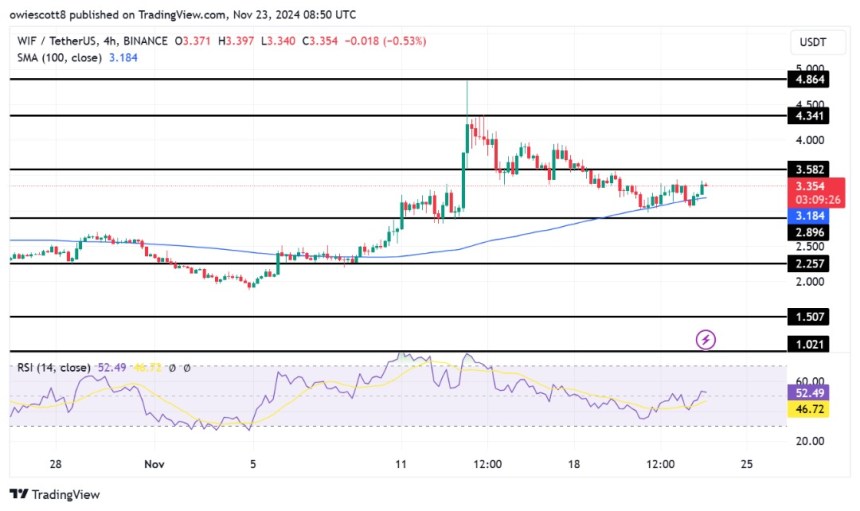
WIF has demonstrated renewed positive strength after rebounding from the $2.89 support level, steadily advancing toward the $3.58 resistance level. This recovery indicates a significant shift in sentiment, with buying pressure triggering more price growth. Also, the cryptocurrency is trading above the 100-day Simple Moving Average (SMA) on the 4-hour chart, which reinforces the bullish trend and a strong foundation for further gains if WIF successfully breaks above the $3.89 resistance.

An examination of the 4-hour Relative Strength Index (RSI) shows that the RSI has climbed back above the 50% threshold after experiencing a decline to 40% signaling a resurgence in buying pressure, reflecting renewed bullish momentum in the market. A persistent climb would indicate strong overbought conditions, suggesting robust demand and the possibility of more price growth.
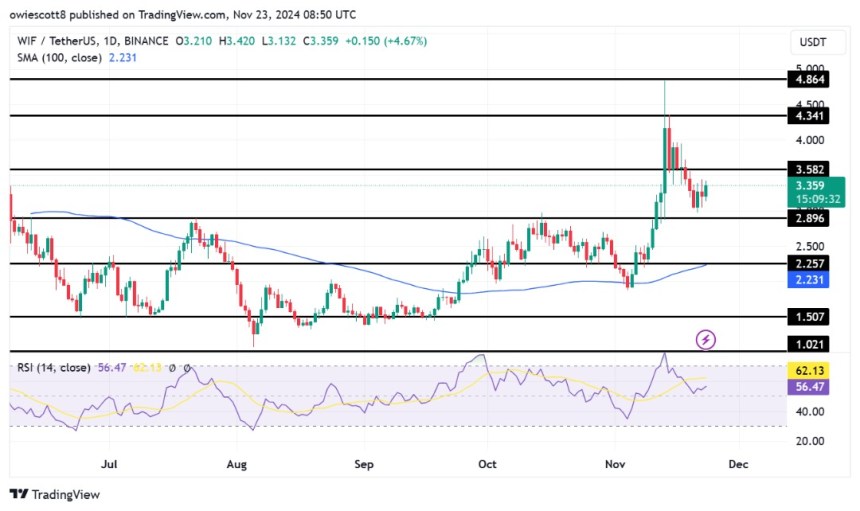
Also, the daily chart highlights WIF’s strong upward momentum, evidenced by the formation of a bullish candlestick as the price rebounds from the $2.89 level. Its position above the SMA further solidifies the positive trend, signaling consistent strength. As WIF continues its ascent, it inspires growing market confidence and paves the way for an extended price increase.

Lastly, the daily chart’s RSI has recently surged to 57%, reflecting a strong wave of optimistic sentiment as it maintains a position above the critical 50% threshold. This rebound comes after a temporary dip to 51%, demonstrating the re-emergence of buyers in the market.
Resistance Levels To Watch: Can WIF Break Through?
As WIF continues its upward trajectory, key resistance levels will play a pivotal role in determining its next move. The immediate challenge lies near the $3.58 mark, a critical threshold that could either pave the way for additional gains or temporarily halt the rally. A successful break above this level could set WIF on course toward new highs, reinforcing its bullish trend.
However, if WIF fails to surpass the $3.89 resistance, it may face consolidation or a pullback toward the $2.89 support level. A breach below this key support could trigger a more significant decline, possibly extending toward the $2.2 level and below.
#TechnicalAnalysis, #Dogwifhat, #RelativeStrengthIndex, #RSI, #SimpleMovingAverage, #SMA, #WIF, #WIFUSD, #WIFUSDT