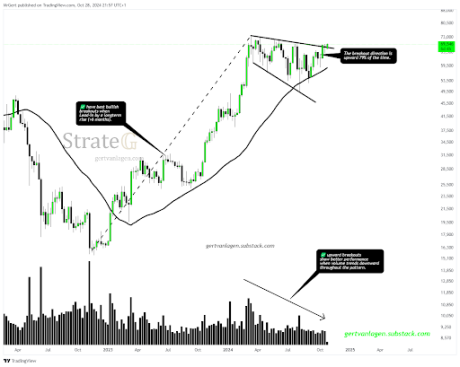
Recent market inflows and dynamics have seen the Bitcoin price breaking free from a 7-month descending broadening wedge pattern. According to crypto analyst Gert van Lagen, Bitcoin’s breakout last week could signal the onset of a major price continuation phase as the bulls aim above the $70,000 mark. Particularly, Van Lagen highlighted that Bitcoin’s ability to successfully retest the upper trendline of this pattern lends strong momentum to the current bullish structure.
The descending broadening wedge pattern is a reversal structure in technical analysis, often hinting at a strong trend upon breakout. Bitcoin’s ability to breach the upper trend line reinforces the likelihood of bullish momentum, lending voice to a new all-time high in the coming weeks.
Bullish Retest Validates Strong Support For Next Rally
At the time of van Lagen’s analysis, the Bitcoin price was retesting a bottom-sloping trend line, which has capped its price rallies since it reached an all-time high of $73,737 in March. By then, Bitcoin had already peaked out of this trend line in the descending broadening wedge and was already on the third candle.
As Bitcoin bounced from the upper trend line, van Lagen described this as a “successful bullish retest.” Furthermore, he noted the importance of a bullish trajectory for this pattern, highlighting that the breakout direction is upward 79% of the time.
With the Bitcoin price now successfully above this wedge, this next phase could see the cryptocurrency extend its gains and surge above $70,000. As such, the analyst also noted that reaching a new all-time high is essential to fully validating the wave continuation pattern.

Key Bitcoin Price Levels To Watch
While the breakout and retest offer promising technical signs, van Lagen warned of a critical downside level that traders should monitor. He pinpointed $58,700 as a crucial weekly closing price, below which the bullish structure would be invalidated. In his view, a close below this threshold would disrupt the quick wave five continuation and totally reverse the bullish setup to a new all-time high.
Interestingly, Bitcoin has managed to push to the upside since this breakout. Particularly, the cryptocurrency has extended gains and has now broken above $71,000 for the first time since June.
At the time of writing, Bitcoin is trading at $71,150, having reached an intraday high of $71,450 in the past 24 hours. As it stands, Bitcoin is only 3.6% away from reaching uncharted price territories. The only key price resistance level to watch at this point would be the current all-time high.
Many Bitcoin metrics point to the continuation of bullish Bitcoin price momentum, at least in the short term. The Bitcoin open interest is now at its highest point of $42.6 billion, which relays a high level of trading activity among Bitcoin traders.
#Bitcoin, #Analyst, #Bitcoin, #BitcoinNews, #BitcoinPrice, #Btc, #BTCNews, #BtcPrice, #Btcusd, #BTCUSDT, #Crypto, #CryptoAnalyst, #CryptoNews