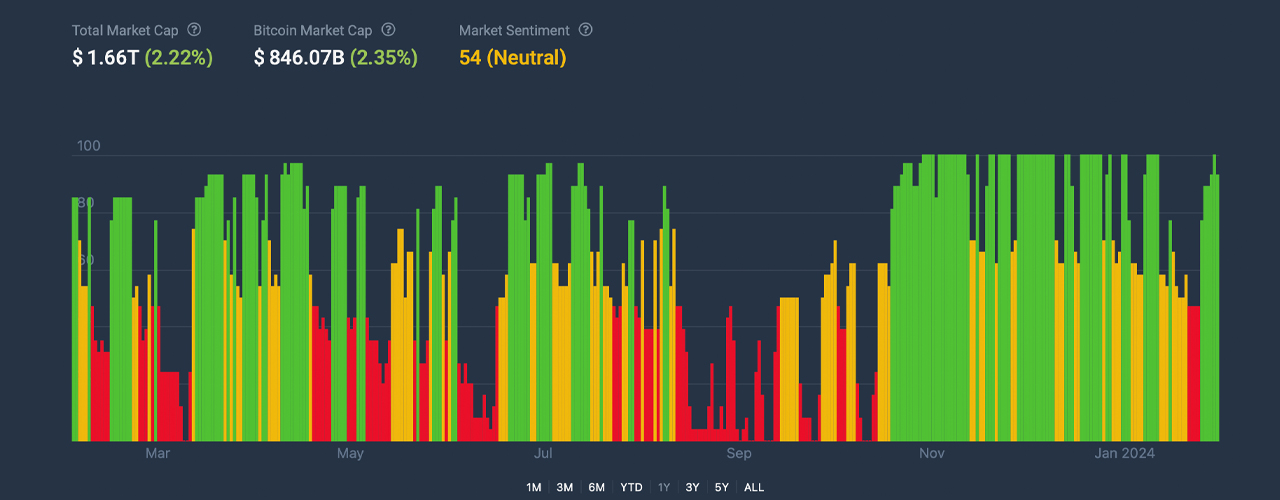
On Friday, the price of bitcoin fluctuated within a daily span from $41,937 to $43,347, with its market value reaching $846 billion. The trading activity for the day tallied up to $17.35 billion, showcasing a spike in investor involvement and market liquidity, which tends to diminish as the weekend approaches.
Bitcoin
The current sentiment towards bitcoin (BTC) is remarkably balanced, with a sentiment score of 54. This equilibrium reflects a cautious optimism among investors, straddling the line between bullish and bearish expectations according to technical analysis. This mood is underscored by recent variations in the Crypto Fear and Greed Index (CFGI), which has oscillated sharply, lately hitting levels that signify “greed” and then back to “neutral.”

The relative strength index (RSI) holds at a neutral point of 54, mirroring the sentiment portrayed by other market oscillators like the Stochastic and commodity channel index (CCI), which signal mixed feelings among market participants. Interestingly, the awesome oscillator hints at a bullish outlook, whereas the momentum Indicator suggests bearish tendencies, highlighting the market’s polarized sentiment.
Moving averages (MAs) across different time frames consistently suggest bullish prospects, with both simple and exponential moving averages (SMA and EMA) ascending from the 10-day through to the 200-day marker. This pattern indicates solid support for bitcoin’s current valuation, despite the day’s price swings. The daily chart accentuates a notable price dip following the approval of spot bitcoin exchange-traded funds (ETFs), succeeded by a large downturn and a subsequent effort to rebound.
Heavy resistance has been identified near $49,000, with prices currently fluctuating between $42,000 and $43,800, signaling a tentative recovery phase absent of definitive signs of a trend reversal. The hourly chart shows reduced volatility with a slight upward trajectory, whereas the 4-hour chart offers a more consolidated perspective, displaying a mild upward trend. These resistance levels present potential short-term trading strategies hinging on breakout or reversal patterns.
Bull Verdict:
The analysis of bitcoin’s performance on Feb. 2, 2024, underlines resilience amidst market volatility. The observed price recovery, coupled with decent trading volume, highlights investor confidence and continued liquidity in the market. With MAs across all periods signaling a bullish trend and the awesome oscillator pointing towards a bull signal, BTC demonstrates a solid foundation for price growth. The neutral stance from the RSI, tempered by positive momentum in the hourly and 4-hour charts, suggests an underlying strength in bitcoin’s market position.
Bear Verdict:
Despite bitcoin’s show of resilience on Feb. 2, 2024, several indicators hint at an underlying market caution. The significant price drop highlighted in the daily chart, followed by a hesitant recovery, suggests vulnerability to more sell-offs and the absence of a definitive bullish reversal. Mixed signals from oscillators, particularly the contrasting sell signal from the momentum indicator, reflect investor uncertainty and a divided market sentiment. The neutral RSI, coupled with resistance levels that capped the day’s gains, underscores the challenges ahead for BTC.
Register your email here to get weekly price analysis updates sent to your inbox:
What do you think about bitcoin’s market action on Friday? Share your thoughts and opinions about this subject in the comments section below.
#MarketsAndPrices, #BitcoinBTC, #BitcoinPrice, #BitcoinTechnicalAnalysis, #Crypto, #Cryptocurrency