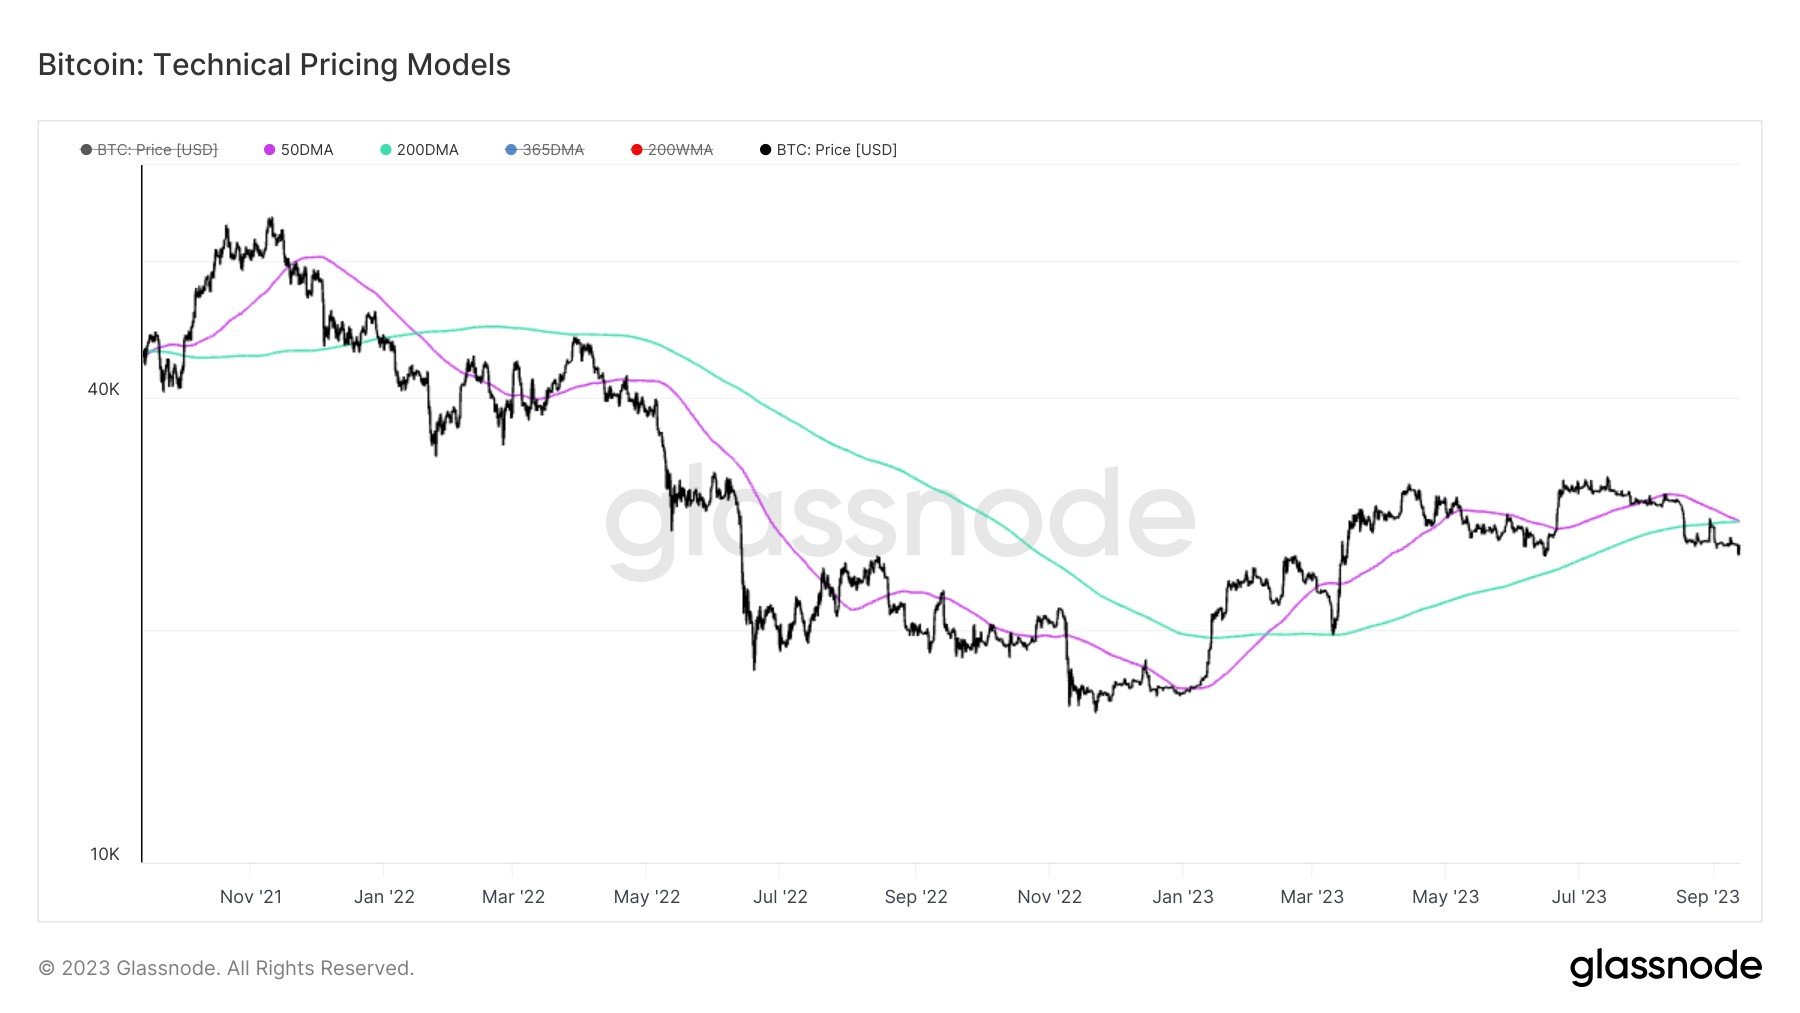
Bitcoin appears to be in the process of forming a death cross currently. Here’s what happened to the asset the last time this pattern emerged.
Bitcoin 50-Day MA Is Moving Below The 200-Day MA Right Now
As pointed out by an analyst in a post on X, the 50-day moving average (MA) has been attempting a cross below the 200-day MA recently. A “Moving Average” is an analytical tool that calculates the average of any given quantity over a specific period of time. As its name suggests, it moves and changes alongside the quantity in question.
The main benefit of an MA is that it removes short-term fluctuations from the data, smoothing out the curve. This makes the study of long-term trends easier to perform.
MAs can be taken over any length of time, whether that be a minute or a decade. There are some periods that are particularly useful, however, like the 50-day and 200-day MAs, which are of relevance in the current discussion.
The interactions between these two Bitcoin MAs have apparently had consequences for the asset’s trend in the past, and the chart below shows how these two MAs have looked recently:
Historically, whenever the 50-day MA has dipped below the 200-day MA, the cross has proved to be a bearish one for the cryptocurrency’s price. In the above graph, it’s visible that the last time this type of crossover occurred was in January 2022.
Back then, the asset had been on its way down from its November 2021 all-time high and the death cross may have cemented the asset’s fate, as a long bear-market drawdown had followed afterward.
The opposite type of crossover, where the short-term MA moves above the long-term one, has generally been a bullish cross instead, as the asset has usually enjoyed uptrends following it. This crossover had been seen earlier in this year as well, after which BTC had gone on to see some significant rise.
Recently, however, as the cryptocurrency’s price has been struggling, the 50-day MA has started to go down and has now neared the 200-day MA. If the former continues in this trajectory and completes the cross below the latter, then another death cross would form for Bitcoin.
Such a cross would be an ominous sign for the asset, as it could imply that a significant drawdown may be ahead for the coin. So far, though, the bearish cross hasn’t been fully confirmed yet.
It now remains to be seen if the death cross will be completed in the coming days, or if BTC would turn itself around before it happens, leading to the 50-day MA pulling away from the 200-day MA for now.
BTC Price
Bitcoin has gone through a bit of a rollercoaster in the past two days, as its price had first dropped towards the $25,100 level, but has since already recovered above $26,100.
#BitcoinNews, #Bitcoin, #BitcoinBearish, #BitcoinDeathCross, #Btc, #Btcusd
