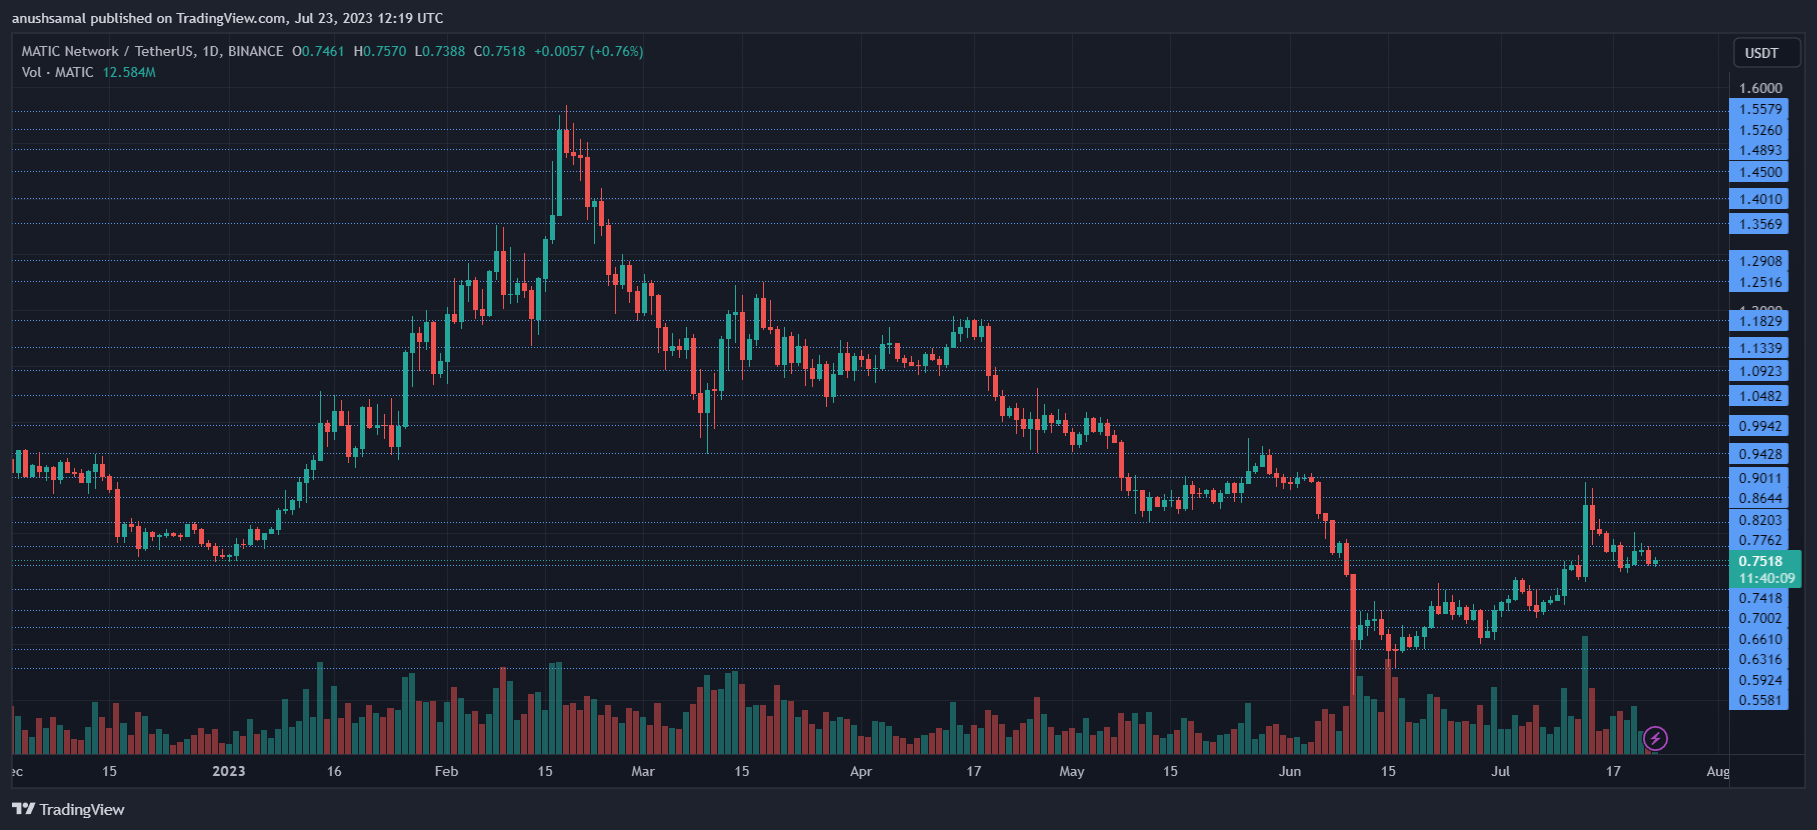
MATIC, following a notable price pullback that briefly dipped to $0.53, has encountered a slowdown in its bullish momentum. Over the past 24 hours, the altcoin witnessed a decrease of around 1.5% in its value, with weekly losses amounting to 4.8%.
Currently, MATIC is hovering around a critical support level. This indicates that bears might dominate the upcoming trading sessions unless they move away from this support zone. To regain bullish traction, MATIC must sustain a price above the current support level.
If successful, the altcoin may attempt to rise again. However, to fully restore its bullish momentum, it will be essential for MATIC to trade above the $0.85 price mark, which has previously acted as significant resistance. The slight decline in MATIC’s market capitalization indicates a potential slowdown in buying strength on its daily chart.
MATIC Price Analysis: One-Day Chart

At the time of writing, MATIC was trading at $0.75, having experienced a sharp decline from its previous position at $0.90. Despite a recovery attempt, MATIC is currently trapped at a crucial support level.
The $0.75 price mark holds significant importance, as failure to sustain it could lead to a loss of buyer momentum, potentially pushing the price down to $0.65.
If the altcoin falls below $0.65, it may further drop to $0.60. For MATIC to reverse its downward trend in the upcoming trading sessions, it must successfully surpass the $0.80 level. Achieving this could propel MATIC towards the challenging resistance at $0.85, a historical price ceiling for the altcoin.
Technical Analysis

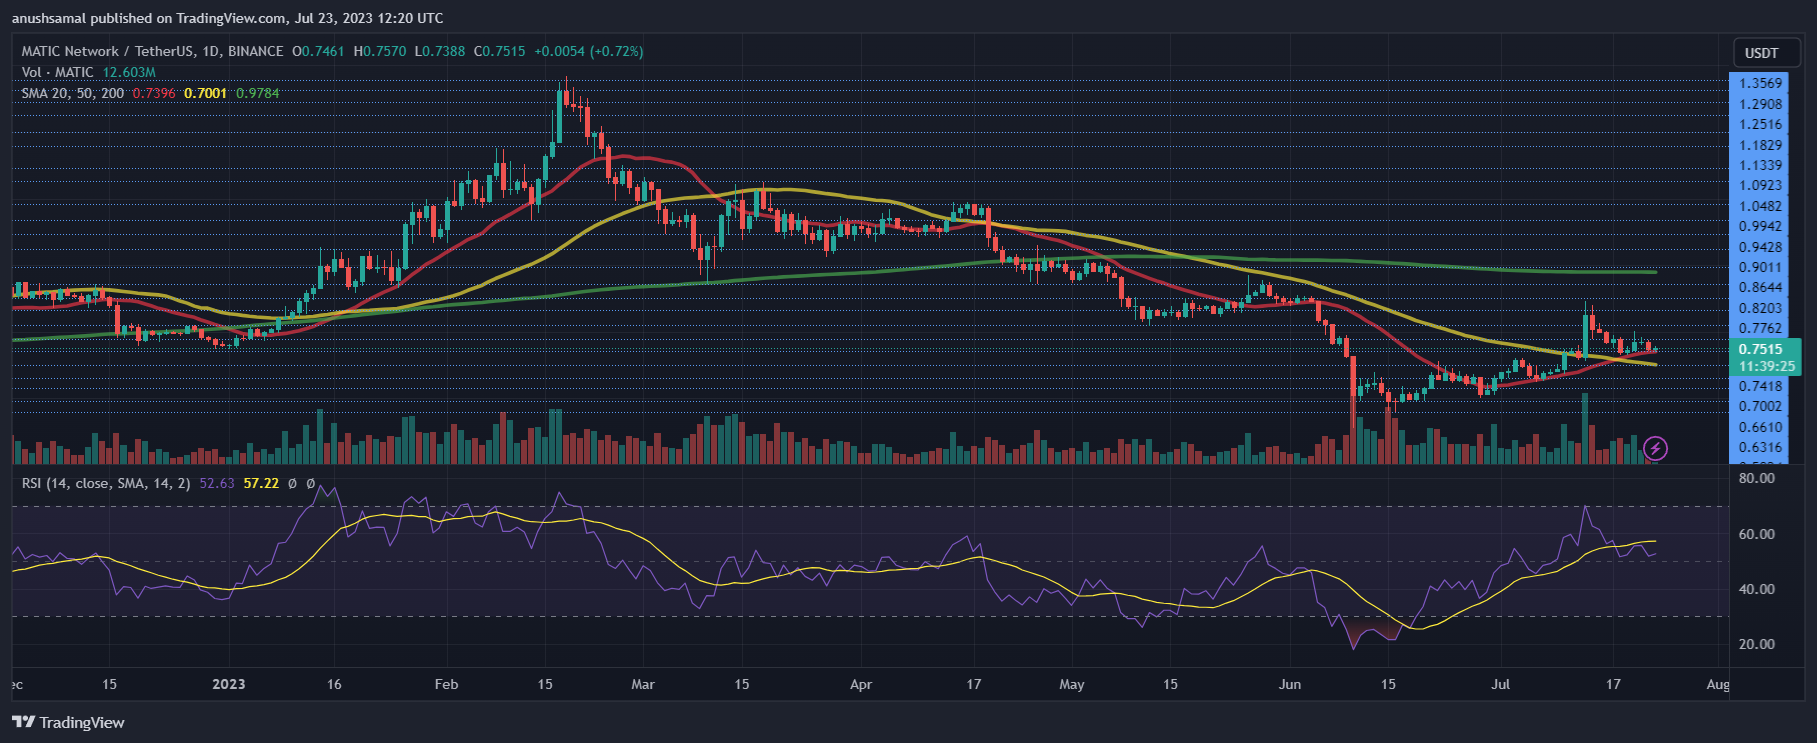
Due to decreased demand, the altcoin experienced a decline in buying strength when it failed to maintain its price at $0.76. Although the Relative Strength Index (RSI) remained above the half-line, the reduced presence of buyers was evident.
If bears push the price further, sellers could gain complete control of the price action. Additionally, the altcoin’s price was slightly above the 20-Simple Moving Average (20-SMA) line.
However, in the next trading session, MATIC might dip below the 20-SMA, indicating a gradual exit of buyers from the market.

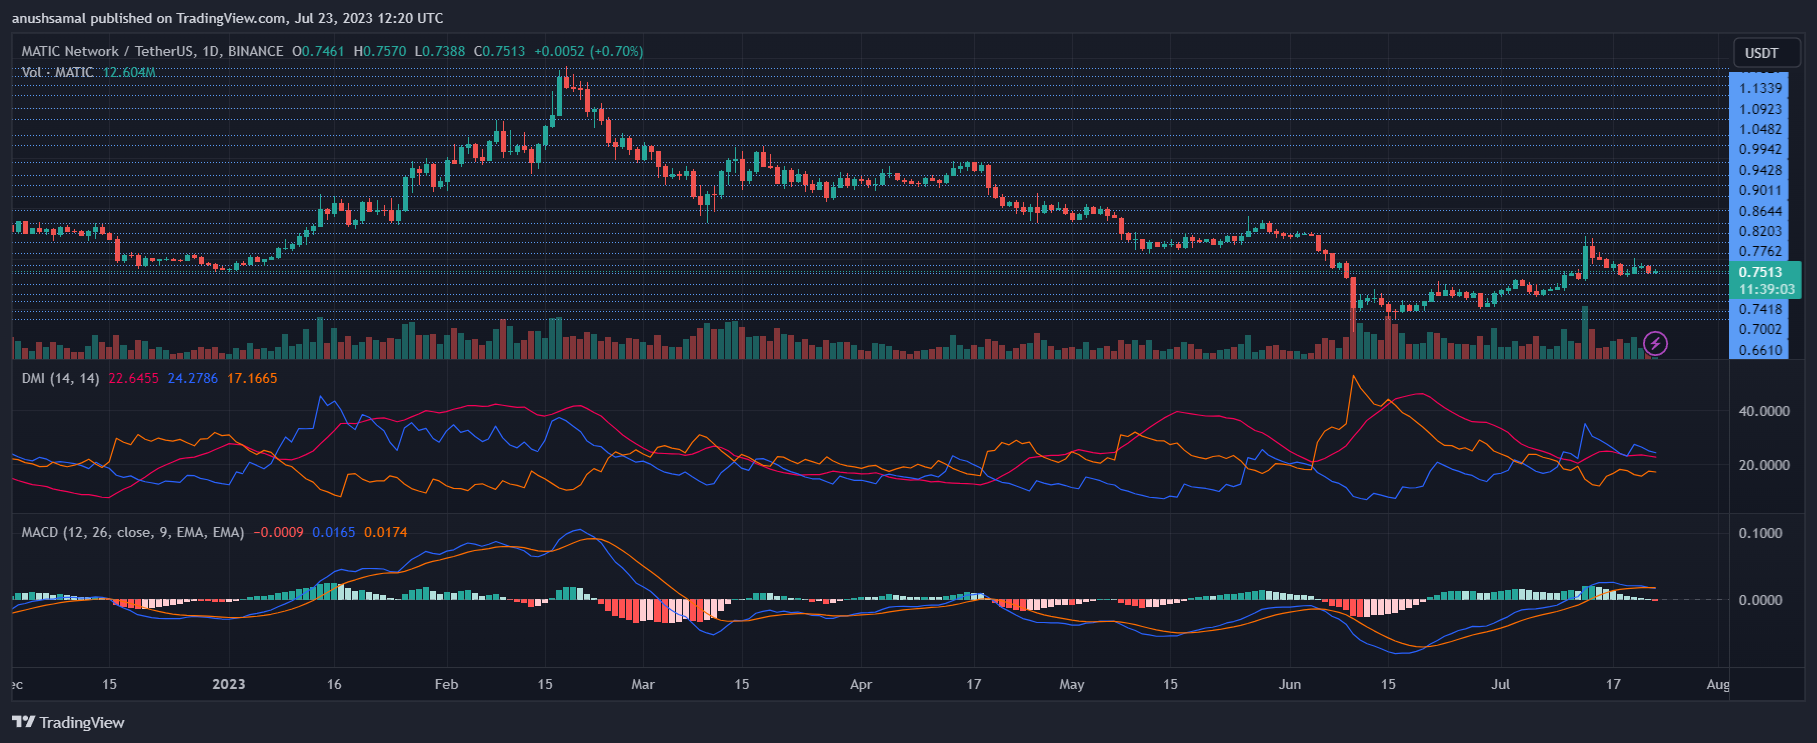
The daily chart for the altcoin has shown clear signs of buyers exiting the market, with a sell signal becoming evident. The Moving Average Convergence Divergence (MACD) displayed one red histogram, signaling a sell indication for the altcoin.
Moreover, the Directional Movement Index (DMI) indicated a negative direction for the asset. The -DI line (orange) crossed over the +DI line (blue), pointing to the altcoin’s bearish movement.
Furthermore, the Average Directional Index (ADX – red) dipped and was close to the 20-mark, suggesting a weakening strength in the bullish price action.