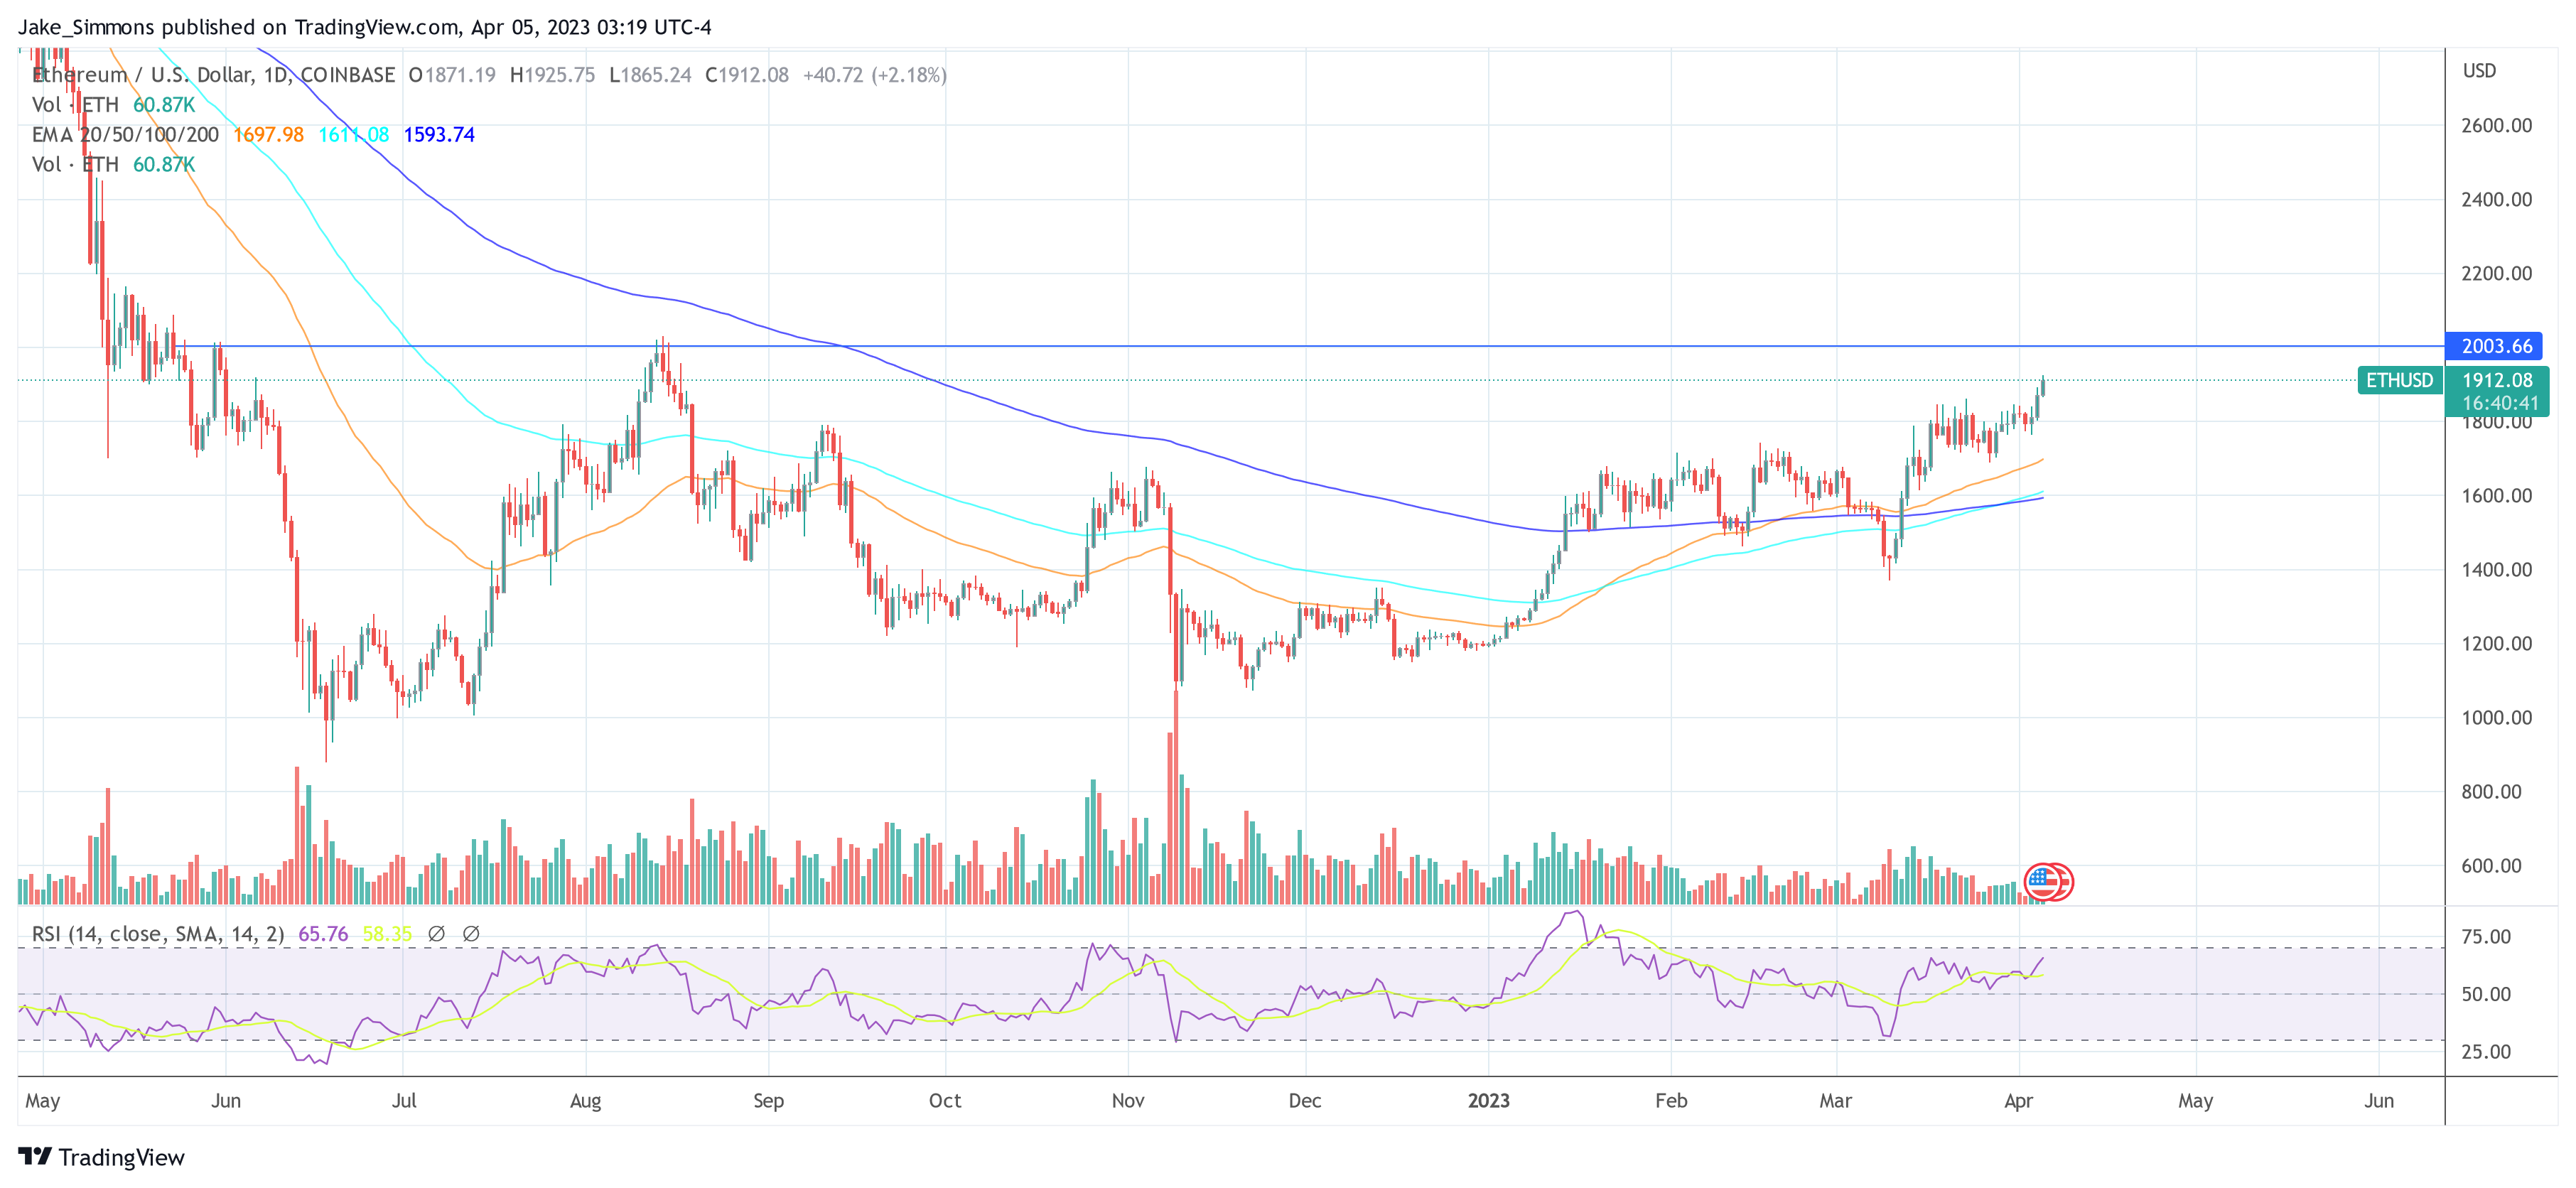
The price of Ethereum (ETH) is currently experiencing a strong upswing, outperforming Bitcoin, which has been able to extend its dominance on the crypto market in recent weeks. Even Bitcoin’s ongoing sideways phase does not seem to worry Ethereum investors, who managed a breakout above $1,900 today.
The psychologically important price target of $2,000 is thus within reach. Eight days before the highly anticipated Shapella update on April 12, the Ethereum chart looks extremely bullish.
Moreover, the trading month of April is statistically one of the most bullish months of the year for the crypto market. Also, ETH is getting tailwinds from the continued weakness of the US Dollar Index (DXY).
Analysts Predict Ethereum To Break Above $2,000
Jonah Van Bourg, head of trading at the crypto asset trading firm Cumberland, published a very bullish analysis on Ethereum via Twitter. As the analyst explains, ETH (unlike Bitcoin) has just broken out of its trading range, which has been in place since mid-March.
And the fact that this is happening against the backdrop of a generally bearish regulatory climate makes it even more special. Moreover, various metrics confirm the strong bullish momentum.
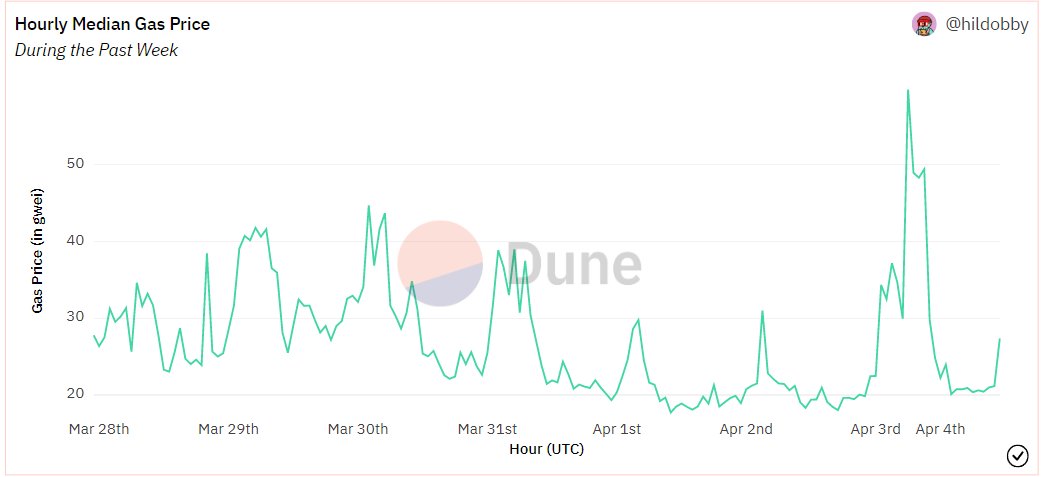
“Doge-themed redesign of Twitter notwithstanding, ETH gas spiked to 68 gwei yesterday – the highest we’ve seen since the Luna crisis of 2Q22 and its associated flurry of DeFi activity,” Van Bourg declared, pointing to the Shapella update as an actually bearish event.

After more than two years, numerous holders will be able to access their staked ETH for the first time, theoretically making large amounts of out-of-the-money ETH units liquid and available for sale. “That said, the exit queue is empty,” Van Bourg noted.
Also bullish is that leverage in the futures market is at a minimum and robust price action suggests that positioning is low and excess longs have already been flushed.
According to the Cumberland analyst, Ethereum’s strength could also be an early indicator for an altcoin rally if the recent past repeats itself. Most recently, it has been seen time and time again how the initial BTC strength spilled over to ETH and then to altcoins.
Thus, all eyes are on ETH at the moment – a solid retracement would represent an important leading indicator and potentially herald a lucrative trading environment.
Cup & Handle Pattern Signals Buying Opportunity
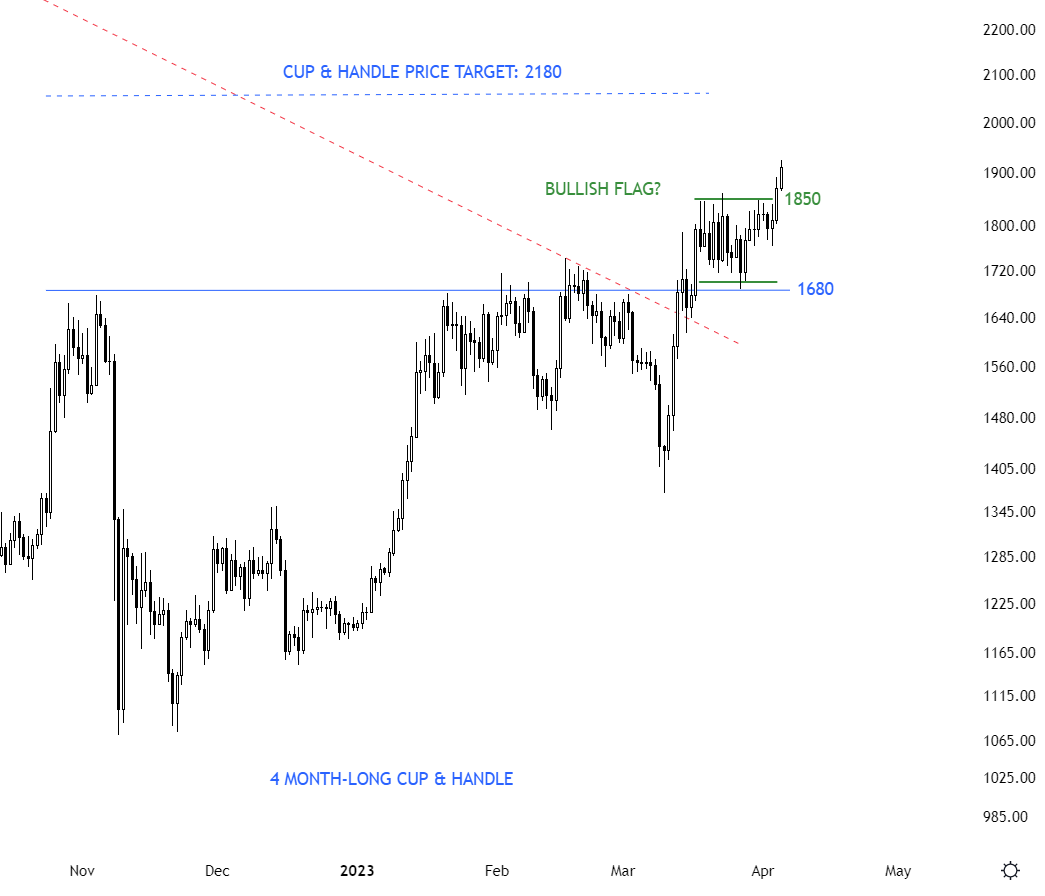
Aksel Kibar, a chartered market technician (CMT) has tweeted that ETH/USD could be two days ahead of the BTC/USD trading pair, according to the bullish flag chart pattern breakout that ETH has is forming, while Bitcoin is trailing.
At the same time, Ethereum has also formed a Cup & Handle pattern over four months on the 1-day chart, as Kibar notes. As the name suggests, the chart pattern resembles a cup with a handle, with the cup shaped like a “U” and the handle drifting slightly downward.

The pattern is considered a bullish signal that extends an uptrend and is usually seen as a buying opportunity.
At press time, the Ethereum (ETH) price stood at $1,912, up 5% in the last 24 hours.
