Dogecoin declined below the $0.14 support against the US Dollar. DOGE tested the $0.070 support and now aims a fresh move above the $0.10 resistance.
- DOGE started a fresh decline below the $0.14 and $0.12 levels against the US dollar.
- The price is trading well below the $0.110 zone and the 100 simple moving average (4-hours).
- There was a break above a key bearish trend line with resistance near $0.088 on the 4-hours chart of the DOGE/USD pair (data source from Kraken).
- The pair must stay above the $0.070 support zone to avoid more losses.
Dogecoin Price Aims Fresh Increase
In the past few days, dogecoin saw a major decline from well above the $0.14 level. DOGE declined below the $0.12 and $0.10 support levels, similar bitcoin and ethereum.
The price even broke the $0.085 support and tested the $0.07 support zone. A low was formed near $0.0699 before the bulls took a stand. The price formed a base above the $0.07 level and recently started a recovery wave.
There was a move above the $0.075 and $0.080 levels. Besides, there was a break above a key bearish trend line with resistance near $0.088 on the 4-hours chart of the DOGE/USD pair. The price is now trading well below the $0.110 zone and the 100 simple moving average (4-hours).
On the upside, the price is facing resistance near the $0.0915 level. It is near the 23.6% Fib retracement level of the downward move from the $0.1609 swing high to $0.0699 low.
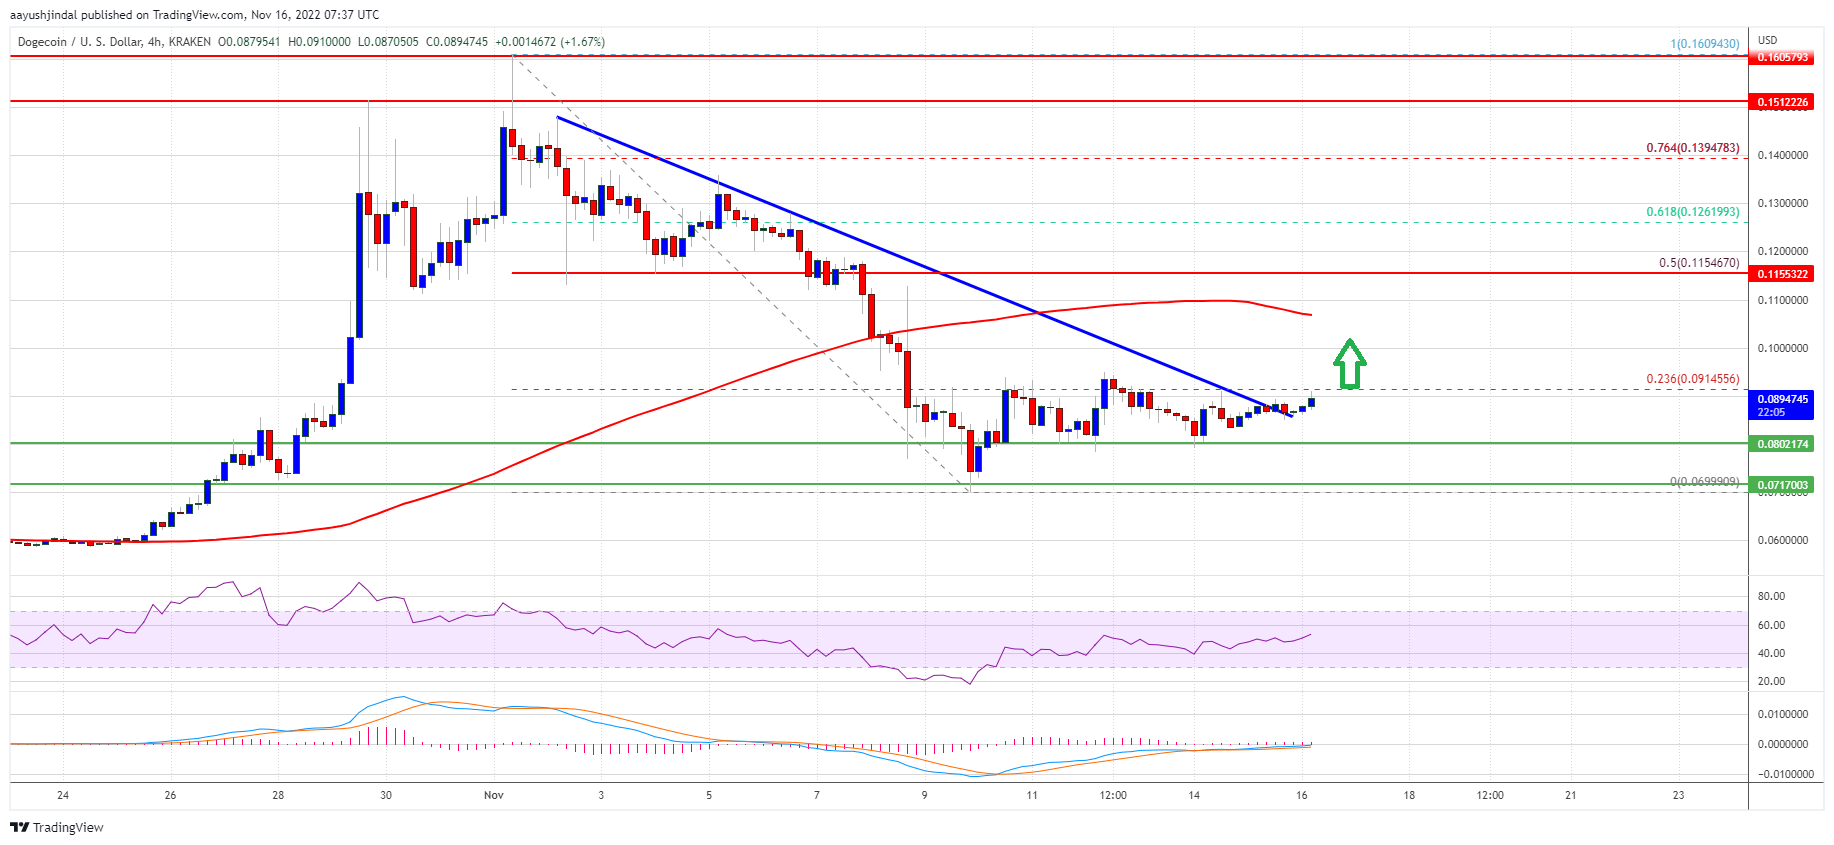
Source: DOGEUSD on TradingView.com
The first major resistance is near the $0.1100 level and the 100 simple moving average (4-hours). Any more gains above the $0.1100 zone could encourage the bulls to aim a test the 50% Fib retracement level of the downward move from the $0.1609 swing high to $0.0699 low at $0.115.
Fresh Decline in DOGE?
If DOGE price fails to gain pace above the $0.10 level, it could start another decline. An initial support on the downside is near the $0.0820 level.
The next major support is near the $0.070 level. If there is a downside break below the $0.070 support, the price could decline further. The main support is near the $0.0500 level. Any more losses could open the doors for a move towards the $0.0450 level.
Technical Indicators
4-Hours MACD – The MACD for DOGE/USD is now gaining momentum in the bullish zone.
4-Hours RSI (Relative Strength Index) – The RSI for DOGE/USD is now above the 50 level.
Major Support Levels – $0.0850, $0.0800 and $0.0700.
Major Resistance Levels – $0.0915, $0.1000 and $0.1100.
#TechnicalAnalysis, #Doge, #DOGEBTC, #Dogecoin, #Dogeusd, #Dogeusdt